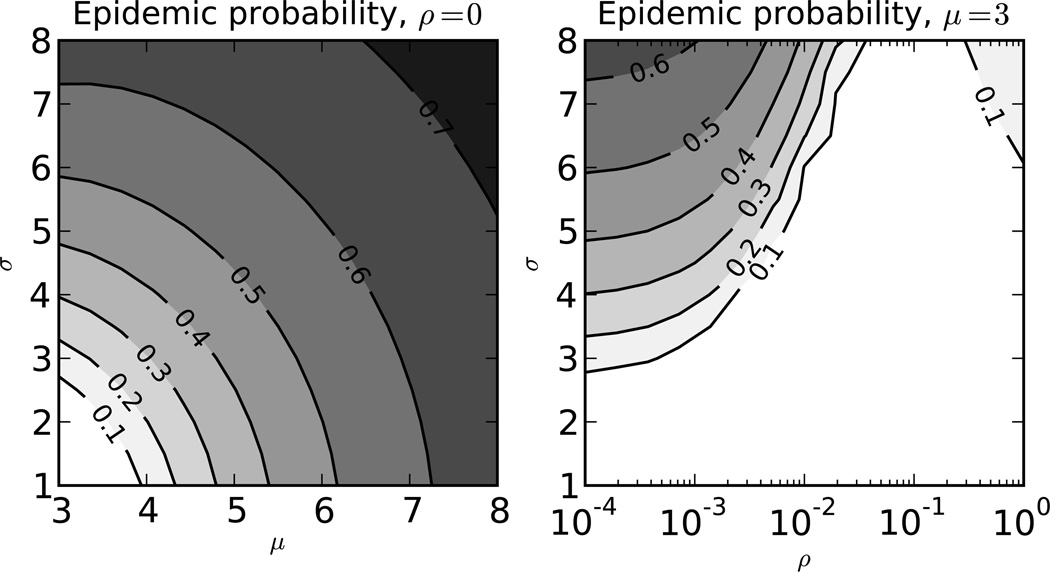
Figure 4.
Effect of contract rate volatility on the probability of an epidemic. This plot shows the effect of the mean (x-axis) and standard deviation (y-axis) of the contact rate distribution on the probability of an epidemic without contact rate volatility (left panel). The panel on the right shows the effect of the standard deviation of contact rates (y-axis) and the degree of contact rate volatility (x-axis). The average duration of a behavioral interval is ρ−1 such that low values of ρ mean essentially static contact rates. The average duration of infection is 148 months with the first 2 months being the first stage and the remainder in the second. The probabilities of infection given contact are 0.05 and 0.001 in the first and second stages respectively.

