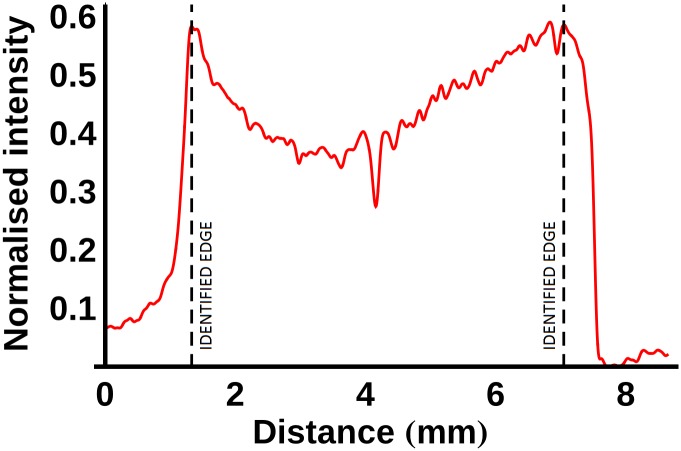
Fig 3. Method adopted for detecting the sample edges.
First the normalised intensity line profile is filtered with a Gaussian kernel with σ = 4 (red line) in order to reduce noise. The maximum (minimum) intensity gradient was detected and the sample edge (dashed, black line) was identified as the next point towards the sample centre at which the absolute value of the intensity gradient was approximately zero (<0.01).

