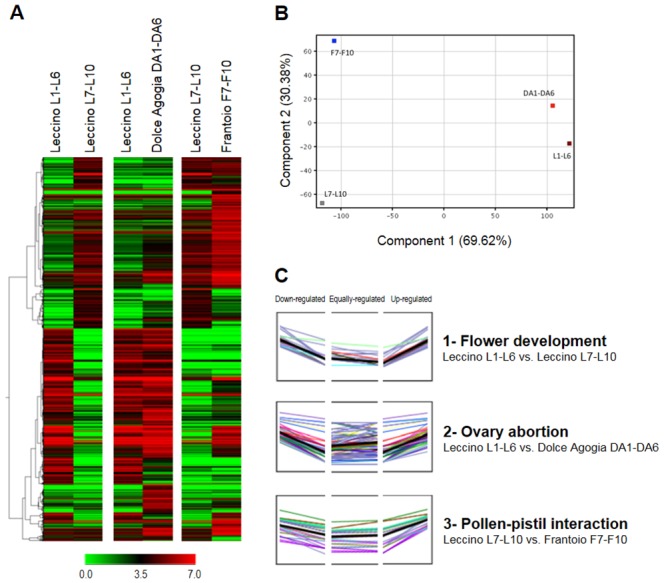
Fig 2. Clustering of the differentially expressed TCs.

(A) Hierarchical Clustering Analysis (HCA). The different shades of green and red represent the down- and up-regulation levels, respectively. (B) Principal Component Analysis (PCA). The percentage of variance explained by each component is shown within brackets. (C) Clustering of the co-expressed transcripts. L1-L6 = Leccino at pre-anthesis, DA1-DA6 = Dolce Agogia at pre-anthesis, L7-L10 = Leccino at anthesis, and F7-F10 = Frantoio at anthesis.
