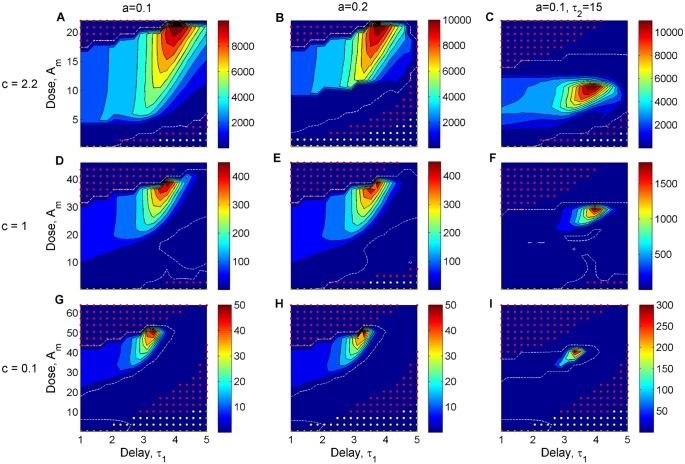
Fig 5. Resistance selection over treated infections, for different combinations of dose Am and delay τ1 in the classical regime.
The simulated values of Am correspond to 30 doses in the range . We plot the proportional change in the resistance burden over treated infection Rtot, relative to the same measure in untreated infection, as a function of antibiotic dose and timing of treatment onset for a range of infection scenarios. In the subpanels, the benefit and cost of resistance, and treatment duration vary as: A) a = 0.1, c = 2.2, τ2 = 7; B) a = 0.2, c = 2.2, τ2 = 7; C) a = 0.1, c = 2.2, τ2 = 15; D) a = 0.1, c = 1, τ2 = 7; E) a = 0.2, c = 1, τ2 = 7; F) a = 0.1, c = 1, τ2 = 15; G) a = 0.1, c = 0.1, τ2 = 7; H) a = 0.2, c = 0.1, τ2 = 7; I) a = 0.1, c = 0.1, τ2 = 15. The resistance selection window is defined by the dashed white line (contour line corresponding to a proportional change of 1). Superimposed are treatment combinations that maintain infection duration within a factor of 1.1 relative to no treatment (yellow dots), and those that, in addition, satisfy a reduction in immunopathology by at least 2-logs order of magnitude (red dots). All parameters as in Table 1, unless otherwise stated. The growth rate of the resistant bacteria Br is varied as r1 = r0 − c (different rows). Moderate dose-delay combinations, applied below the resistance selection window at each infection, can be effective in clearing the pathogen, in synergy with host immune responses. The aggressive high doses instead are effective without relying on the contribution by the immune system.

