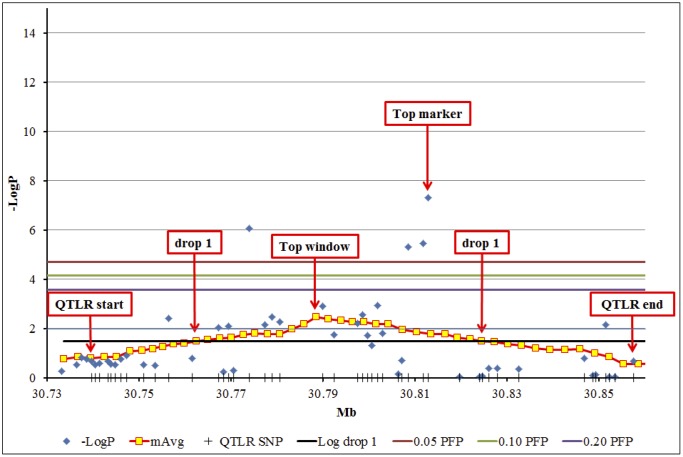
Fig 2. Expanded view of the QTLR at 30 Mb on BTA 29 (Fig 1 and Table 2).
Vertical bars on the X-axis, QTLR marker locations; Blue diamonds, -LogP values of the markers; Yellow squares: X-axis, mean location of the markers in the window; Y-axis, mean -LogP of the window. QTLR start and end, up- and down-stream boundary markers of the QTLR; Drop 1, up and down-stream Log drop 1 boundary windows; Top window, the window with highest average -LogP; Top marker, the most significant marker of the cluster. Three uppermost horizontal bars from top down: significance thresholds for individual markers at PFP = 0.05, 0.10 and 0.20, respectively. Two lowest horizontal bars, from top down: significance threshold for moving average of -LogP = 2.0; Log drop 1 threshold (from Peak window), respectively.

