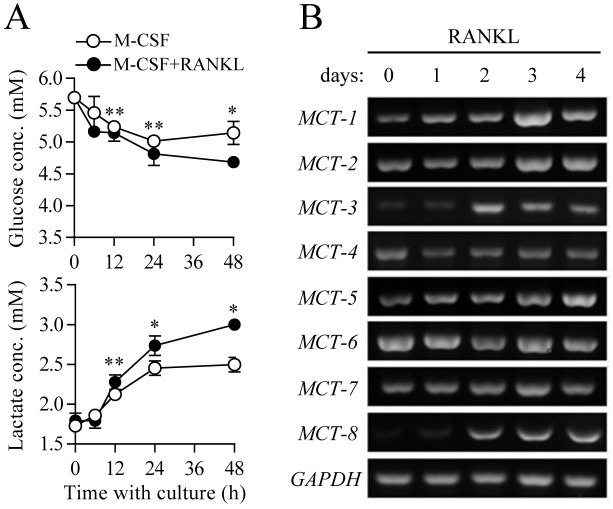
Fig 1. Increased glycolytic metabolism during osteoclast differentiation.
Osteoclast precursors were cultured with M-CSF (30 ng/ml) and RANKL (100 ng/ml) for the indicated times. (A) Glucose and lactate contents in cell culture media. Concentrations of glucose and lactate in the culture medium were measured. Data are given as mean ± SD for a representative experiment run in triplicate. *P < 0.01, **P < 0.05. (B) Gene expression analysis of monocarboxylate transporters (MCTs) during osteoclast differentiation. Total RNA isolated from cells was subjected to RT-PCR analysis of the indicated mRNAs. Level of glyceraldehyde 3-phosphate dehydrogenase (GAPDH) served as an internal control for equal loading.

