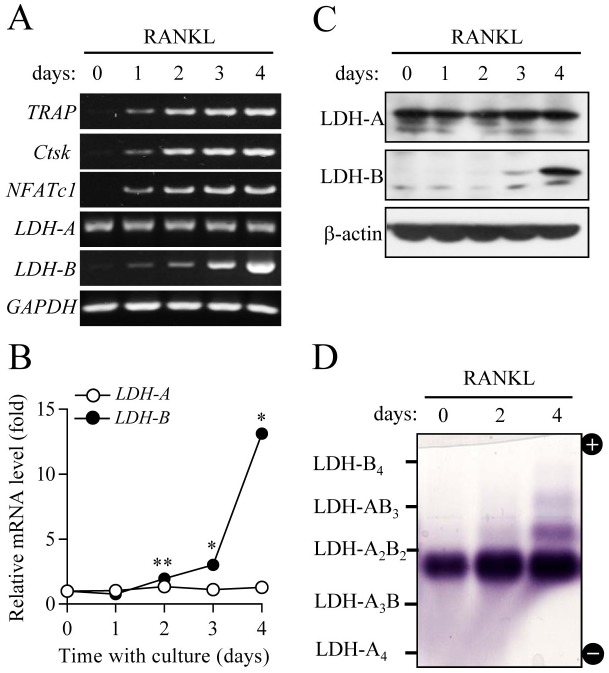
Fig 2. Changes in LDH gene expression and isotypes during osteoclast differentiation.
Osteoclast precursors were cultured in the presence of M-CSF (30 ng/ml) and RANKL (100 ng/ml) for 4 days. (A and B) mRNA levels of LDH-A and LDH-B were determined using RT-PCR (A) and quantitative real-time PCR (B). Data for (B) are means ± SD for a representative experiment run in triplicate. *P < 0.01, **P < 0.05. (C) Protein levels of LDH-A and LDH-B were analyzed using immunoblot analysis. GAPDH and β-actin were used as loading controls. (D) Profiling of LDH isotypes. To analyze LDH isotypes, agarose gel electrophoresis was performed, and the activities were visualized by a formazan color reaction.

