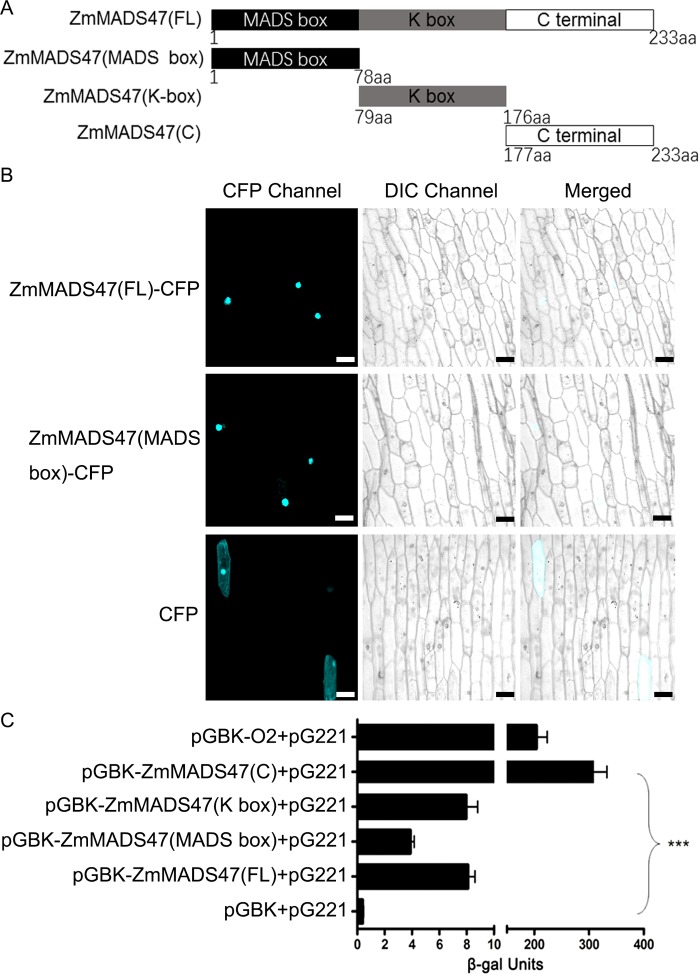
Fig 2. Sub-cellular localization and transactivation identification of ZmMADS47.
A. Schematic representation of multiple truncated ZmMADS47 constructions. B. Fluorescence signal resulting from expression of ZmMADS47 (FL)-CFP, ZmMADS47 (MADS)-CFP and CFP alone. Signal from CFP, DIC (differential-interference microscope) and merging the two signals are shown in these panels. Bar represents 50μm. C. The β-galactosidase activity resulting from the TF transactivation. O2 was used as a positive control, while the pGBK-T7 vector alone was used as a negative control. Error bars represent SD (n = 3) (***P < 0.001, Student’s t test).

