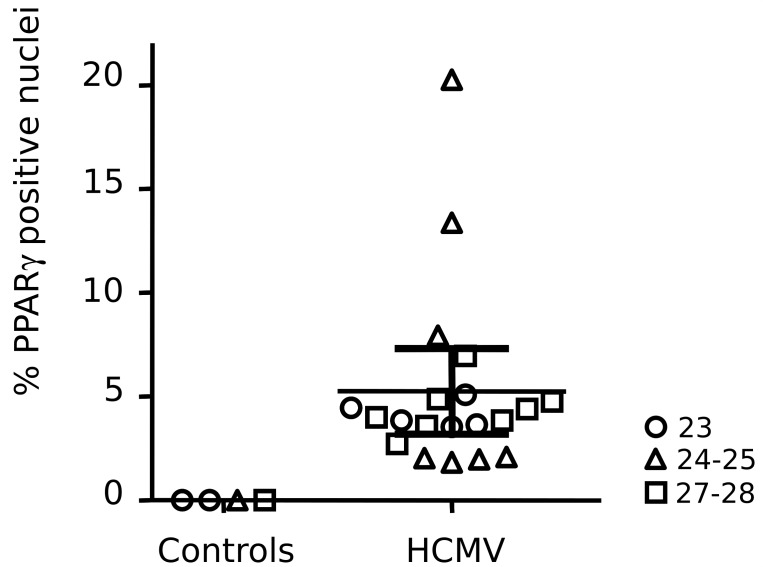
Fig 10. Summary of the immunohistological exploration of PPARγ expression in HCMV fetal cases and controls.
Each symbol represents the mean relative numbers of PPARγ immunoreactive nuclei in optical fields (n = 6, magnification: x40) found in the brain germinal zone for each individual. Thin horizontal line indicates the average ratio of PPARγ positive cells found in patients, and thick horizontal lines indicate the corresponding SEM. Symbols indicate gestational age in weeks.

