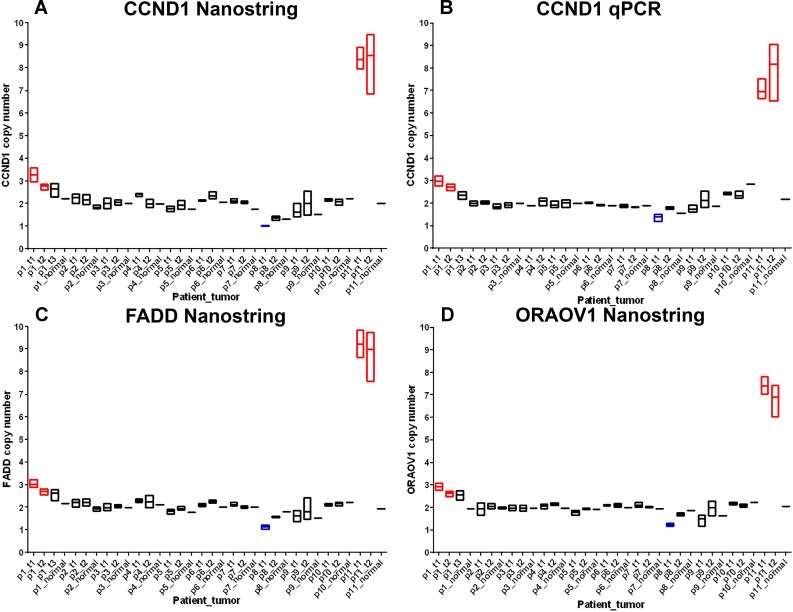
Fig 2. 11q13.3 gene copy number in 11 MF ILC patients.
Gene copy number was measured in three punches from each focus and a single punch from matched adjacent normal tissue where available. Ends of each box are minimum and maximum copy number and floating bar shows mean copy number. Copy number was measured by Nanostring and qPCR platforms. Patients are labelled p1-11 and foci are labelled t1, t2 and t3 in order of size, hence p1_t1 = patient 1, focus 1. Amplifications are highlighted in red and deletions in blue. A. CCND1 copy number by Nanostring; B. CCND1 copy number by qPCR; C. FADD copy number by Nanostring; D. ORAOV1 copy number by Nanostring.

