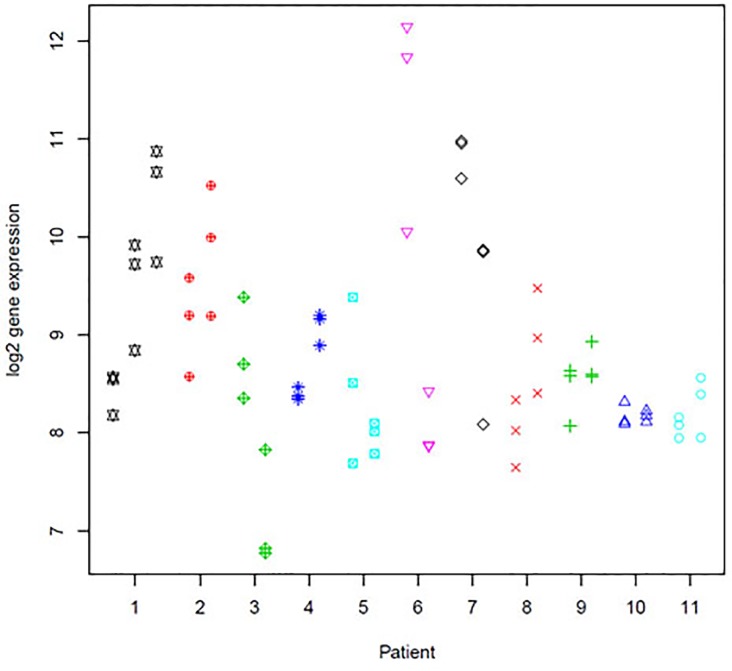
Fig 4. CDH1 gene expression in 11 ILC patients with multiple foci.
Log2 gene expression is plotted for three punches from each foci in each patient. For each patient, foci are shown in order of size with punches from the largest focus always displayed to the left and punches from the smallest focus (for which tissue is available) to the right, in the same order as shown in Table 1.

