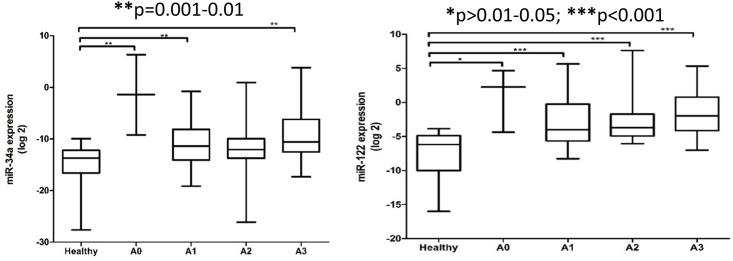
Fig 4. Relative expression of serum miR-34a and miR-122 among healthy controls and NAFLD patients at various degree of inflammation.
The P values were calculated according to Kruskal-Wallis test with Dunn’s multiple comparison post-test. In the boxplots, the vertical lines indicate the range and the horizontal boundaries of the boxes represent the first and third quartile. The lines inside the boxes denote the medians. * p>0.01–0.05; ** p = 0.001–0.01; *** p<0.001.

