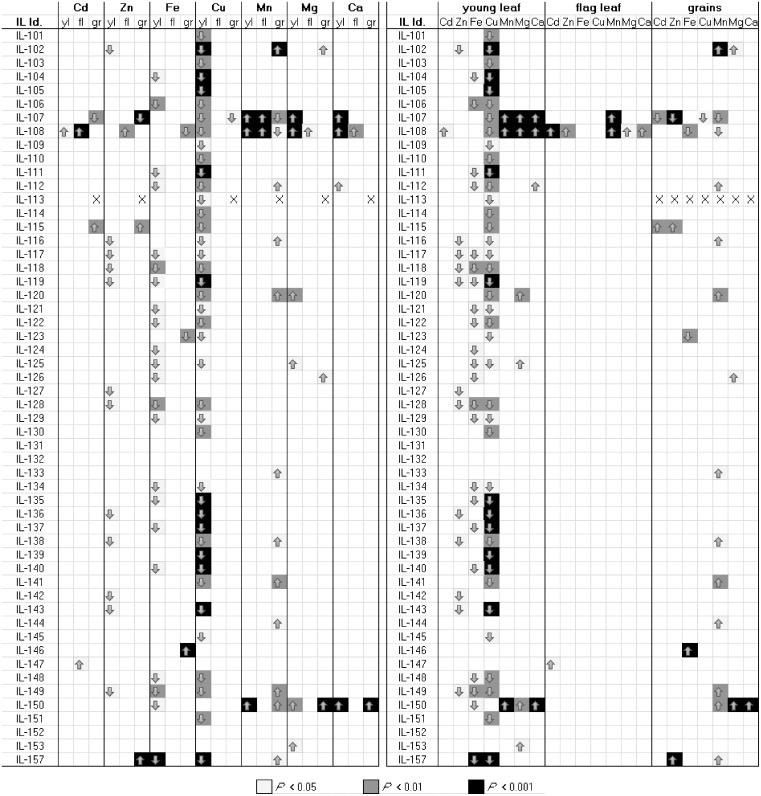
Fig 2. Overview of all QTL detected in all tissues.
Shown is an overview of all statistically significant effects on concentrations of Cd, Zn, Fe, Cu, Mn, Mg and Ca in the young leaf (yl), flag leaf (fl) or the grains (gr). The same dataset is shown twice, (A) grouped by element, and (B) grouped by tissue. Arrows show the direction of the effect relative to the recurrent parent Scarlett, background color of boxes show P values as a measure of statistical significance (FDR_P; see legend). Genotype effects were detected using a mixed model approach as described in materials and methods (main text). Statistical significance was tested using Dunnett’s test, followed by FDR analysis.

