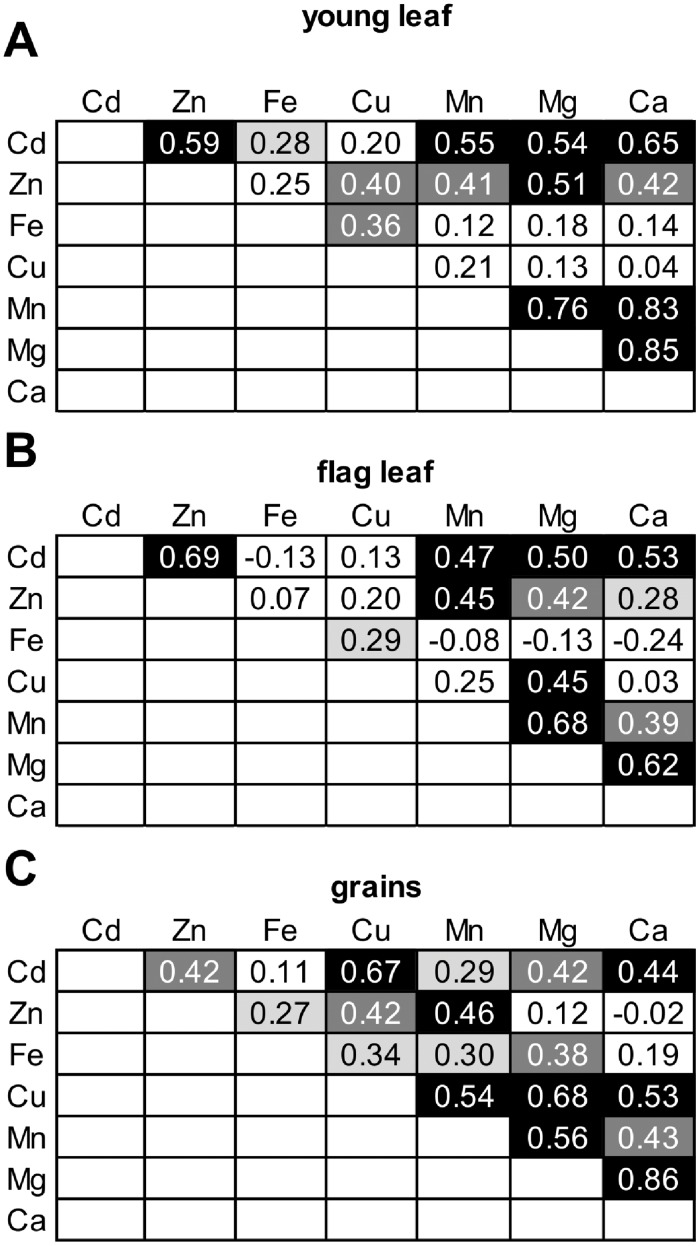
Fig 4. Between-element correlations of concentrations in tissues of barley ILs.
Pearson correlation coefficients (r) are given for (A) the young leaf, (B) the flag leaf and (C) grains. Values are based on least-square means of 54 ILs and the recurrent parent Scarlett. Correlations exhibiting r > |0.27|, |0.35| and |0.44| are statistically significant at P < 0.05 (light grey), 0.01 (dark grey) and 0.001 (black), respectively, according to a two-tailed distribution and n = 55 observations. Measurements were from the same experiment as shown in Fig 1.

