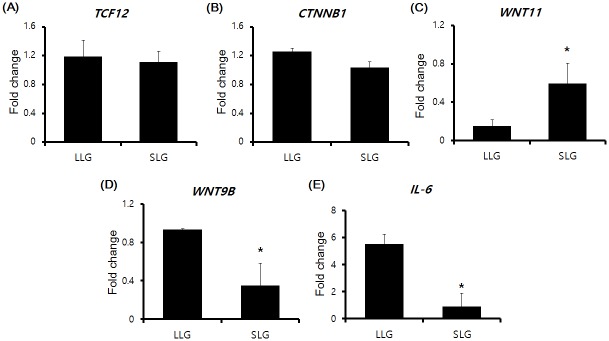
Fig 5. RT-qPCR analysis to assess TCF12, CTNNB1, WNT11, WNT9B and IL-6 mRNA expression.
RNAs from three different individual placentas each were prepared from LLG and SLG. RT-qPCR was performed using gene-specific primers. PPIA was used as a universal control. The RT-qPCR data were analyzed by relative quantification using 2-ΔΔCt. Data are expressed as means ± standard deviation (S.D.). Each experiment was performed in triplicate. *, p < 0.05 versus SLG.

