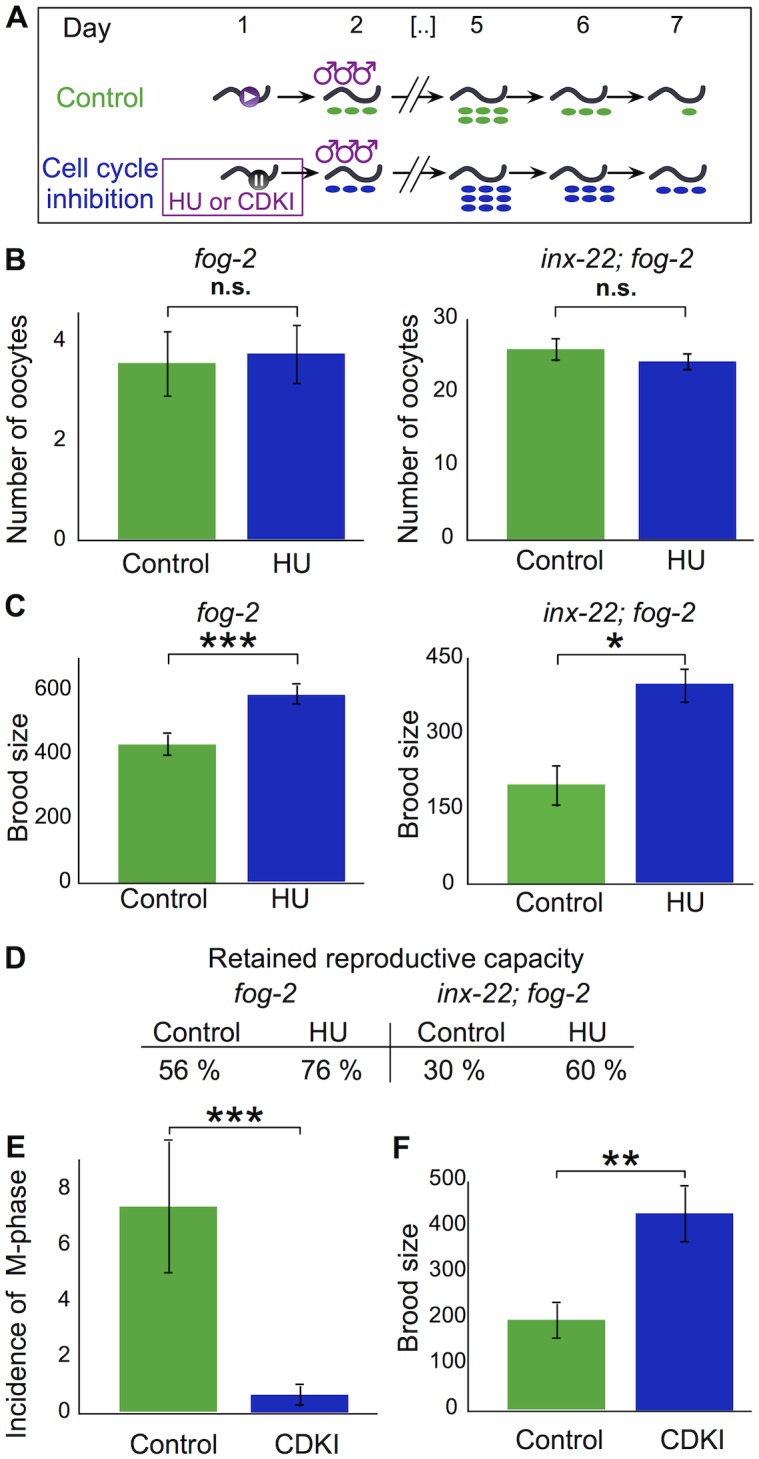
Fig 3. Stem cell cycling drives reproductive senescence.

(A) Schematic of cell cycle inhibitor experiments. (B) Total number of oocytes produced by fog-2 or inx-22; fog-2 females during the HU treatment window. For statistical tests see S3A Table. (C) Brood size for fog-2 or inx-22; fog-2 females mated after the HU treatment window. For statistical tests see S3B Table. (D) Reproductive capacity retained by fog-2 or inx-22; fog-2 females after HU or control treatment (computed by dividing numbers used in C by reproductive capacity at day 0). (E) Incidence of cells in M-phase following 24 h treatment with CDK inhibitor Roscovitine or control treatment with DMSO only. For statistical tests see S3D Table. (F) Brood size for fog-2 females mated after the Roscovitine treatment window. For statistical tests see S3E Table. Error bars represent 83% confidence intervals; asterisks indicate significance of Wilcoxon rank sum test p-value.
