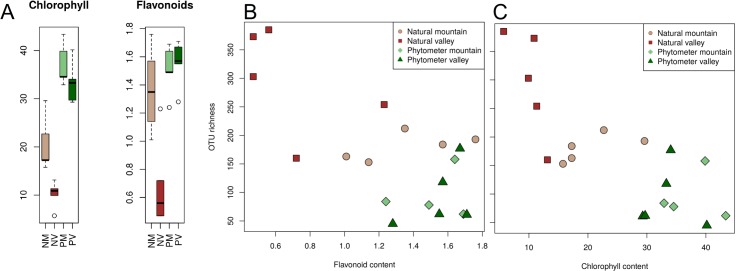
Fig 5. Chlorophyll and flavonoid contents of living leaves.
[A] displays pigment contents (in μg cm-2) as box-whisker diagrams separated into the four different sample groups "natural mountain" (NM), "natural valley" (NV), "phytometer mountain" (PM) and "phytometer valley" (PV). [B and C] display relations of flavonoids and chlorophylls to OTU richness. Values differed significantly between phytometer and natural trees (KS test, D = 0.9, p < 0.01). The pigment concentrations were significantly higher in natural mountain than in natural valley samples (D = 1, p = 0.01), but did not differ within the phytometer samples (D = 0.55, p = 0.43).

