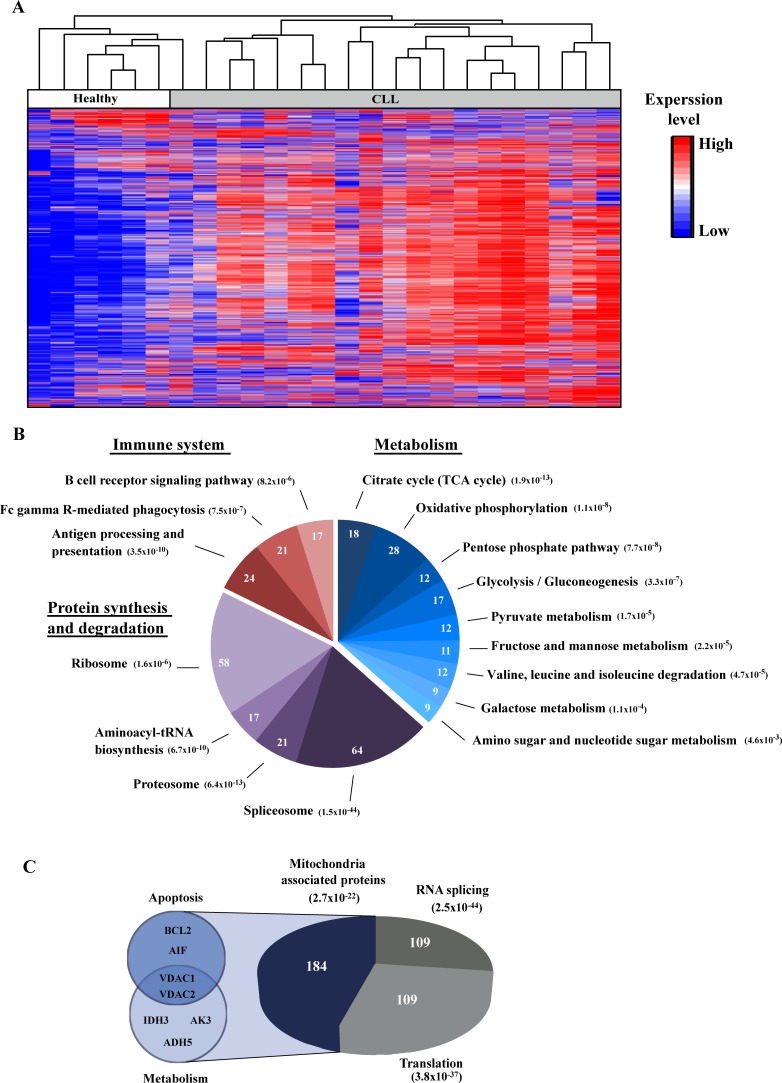
Fig 1. Hierarchical clustering and functional analysis of proteins expression in PBMCs obtained from healthy controls and CLL patients.
The protein expression profiles of PBMCs obtained from healthy donors and CLL patients were analyzed by LC-HR-MS/MS as described under Materials and Methods. A. Hierarchical clustering based on the expression pattern of all 2,441 detected proteins with at least 1 unique peptide is presented. Healthy (white) and CLL (grey) are indicated. The color scale of the standardized expression values is shown on the right. B. Significantly enriched pathways associated with differentially expressed proteins in CLL, with their enrichment p-value, are presented. The number of proteins related to each pathway is indicated inside the chart. C. Significantly enriched functional groups based on the DAVID functional analysis are presented, with their enrichment p-value. The number of proteins related to each functional group is indicated inside the chart. Small pies on the left indicate apoptosis- and metabolism-related proteins of interest.

