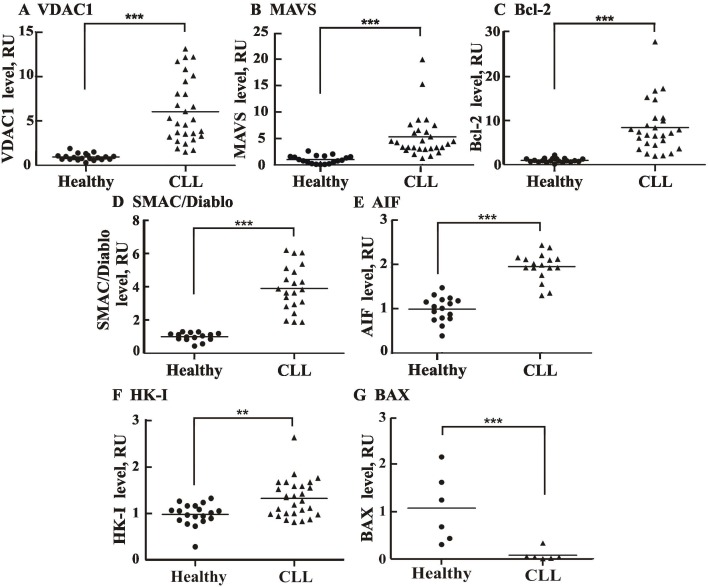
Fig 4. Comparison of apoptosis-related proteins in CLL patient- and healthy donor-derived PBMCs.
Scatter plots display the expression levels of VDAC1 (A), MAVS (B), Bcl-2 (C), SMAC/Diablo (D), AIF (E), HK-I (F) and Bax (G), for each control subject and CLL patient, as analyzed in Fig 2. Statistics were calculated with GraphPad Prism software. Horizontal lines represent mean values for each group. A difference between the healthy donor and CLL patient groups was considered statistically significant when P < 0.001 (***) or P < 0.01 (**), as determined by the Mann-Whitney test.

