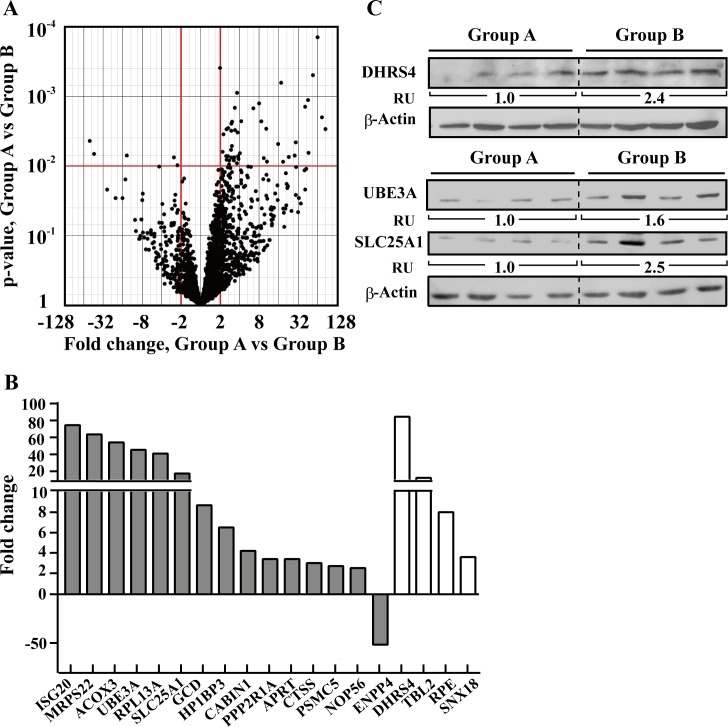
Fig 7. Differentially expressed proteins between CLL patients in a stable disease state and those transferred to anti-cancer treatments.
A. A volcano plot shows proteins expression comparison between CLL patients in a stable disease state (group A) and patients transferred to anti-cancer treatments (group B). Presented are p-values and the magnitude of the difference in expression values (fold change) between groups B and A. Red lines indicate a nominal p-value cutoff of 0.01 and a fold change cutoff of |2|. Nineteen proteins passed the cutoff values of p-value < 0.01 and FC ≥|2|. B. Differentially expressed proteins between groups A and B (p-value <0.01, FC ≥|2|) are presented, divided as proteins reported to be associated (grey) or not associated (white) with cancer. C. Representative immunoblots shows the expression levels of DHRS4, UBE3A, and SLC25A1 in patients from groups A and B. Protein level was determined and normalized to β-Actin. Fold change is indicated for each group as relative units (RU).

