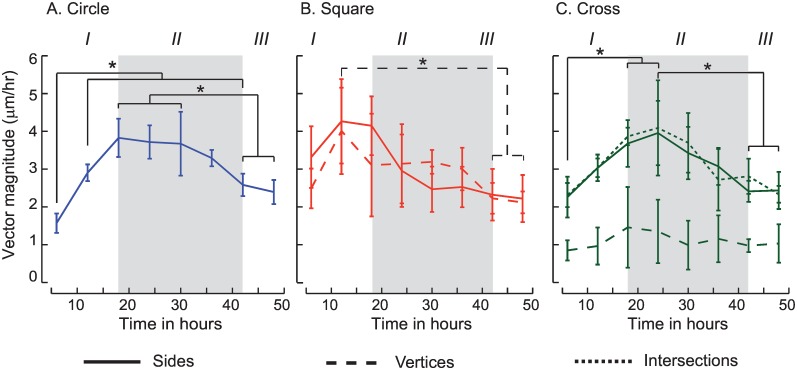
Fig 4. Cluster speeds show temporal differences in the different regions of the circle (A), square (B) and cross (C) shapes respectively.
Speeds from the sides increase (I), plateau (II) and finally decrease (III) over time. These results show clear differences in cluster edge speeds which depend on spatial location in the geometry. Significant differences (p<0.05) in speeds are indicated in each figure.

