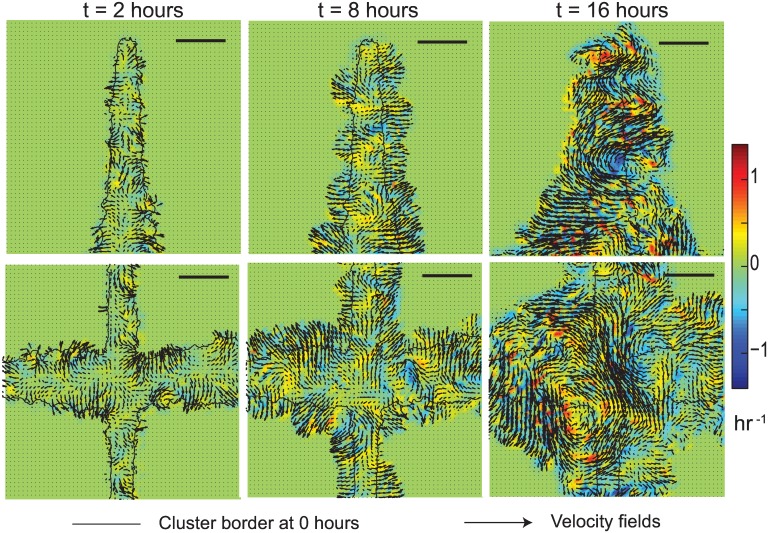
Fig 6. Velocity fields and vorticity maps for MDCK cells are shown at 2 hours (A, D), 8 hours (B, E) and 16 hours (C, F) after removal of constraint.
The cluster border is also shown at 0 hours for reference. Cells in the vertices show minimal movement as compared to those in the sides and intersections (D, E, F). We see the development of vortices, in both clockwise (blue) and counter clockwise (yellow-red) directions at intersections by 16 hours. Scale bar = 250 μm.

