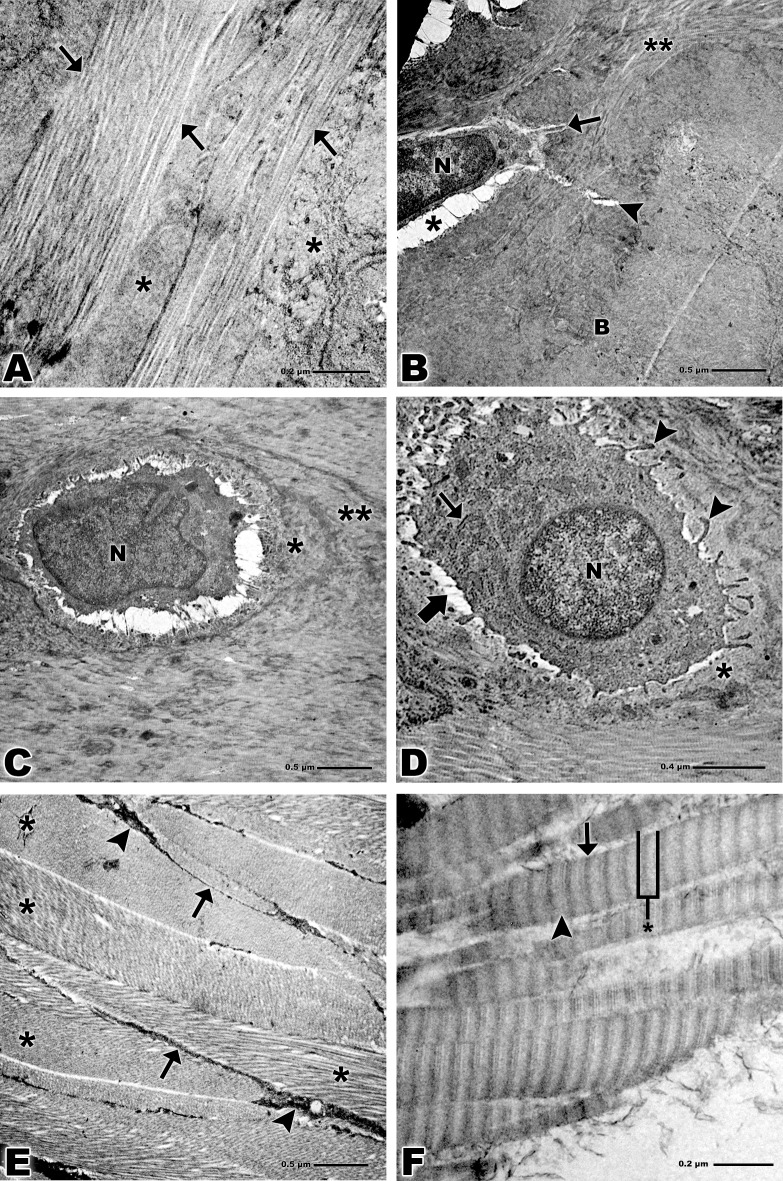
Fig 4. Transmission electron microscopy of bone-tendon junction of the calcaneal tendon of adults Wistar rats.
(A) Collagen fibers of the tendon (arrows), calcified fibrocartilage (*). Bar: 0.2 μm, x15,000. (B) Collagen fibers (**), osteocyte nucleus (N), lacuna (*), cellular process (arrow), canaliculus (arrowhead), bone (B). Bar: 0.5 μm, x6,000. (C) Nucleus of fibrocartilage cell (N), territorial matrix (*), inter-territorial matrix (**). Bar: 0.5 μm, x6,000. (D) Nucleus of fibrocartilage cell (N), rough endoplasmic reticulum (small arrows), lacuna (larger arrow), cytoplasmic processes (arrowheads), territorial matrix (*). Bar: 0.4 μm, x10,000. (E) Bands of collagen fibers of the tendon tissue (*), tenocytes (arrowheads), cytoplasmic prolongation (arrows). Bar: 0.5 μm, x6,000. (F) Striations of the collagen fibrils of the tendon, overlap (arrow), gap (arrowhead) and overlap plus gap called the D-period (*). Bar: 0.2 μm, x94,000.

