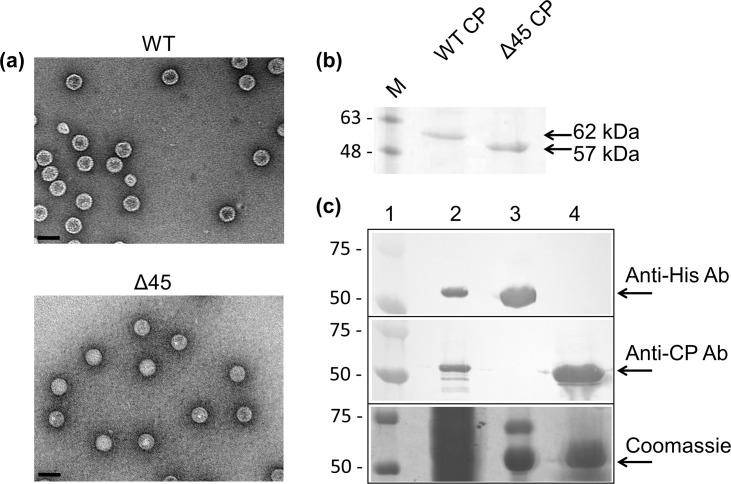
Fig 6. Co-expression of the hPBV RdRP and CP.
(a) TEM images of the purified hPBV VLPs for the WT CP (top) and the Δ45CP (bottom). The scale bar represents 50 nm. (b) SDS-PAGE analysis of the recombinant capsids of both the full-length and Δ45 CPs. (c) Co-expression of the hPBV CP and RdRP. Samples included are a prestained protein marker (lane 1), the soluble fraction of the cell lysate (lane 2), the Ni-NTA bound fraction (lane 3), and the purified VLPs (lane 4). Proteins were separated by SDS-PAGE and detected by Western blot using either anti-6xHis or anti-CP antibodies (two upper panels) or staining with Coomassie blue (lower panel). The molecular weights of the pre-stained marker proteins are indicated in kDa on the left.

