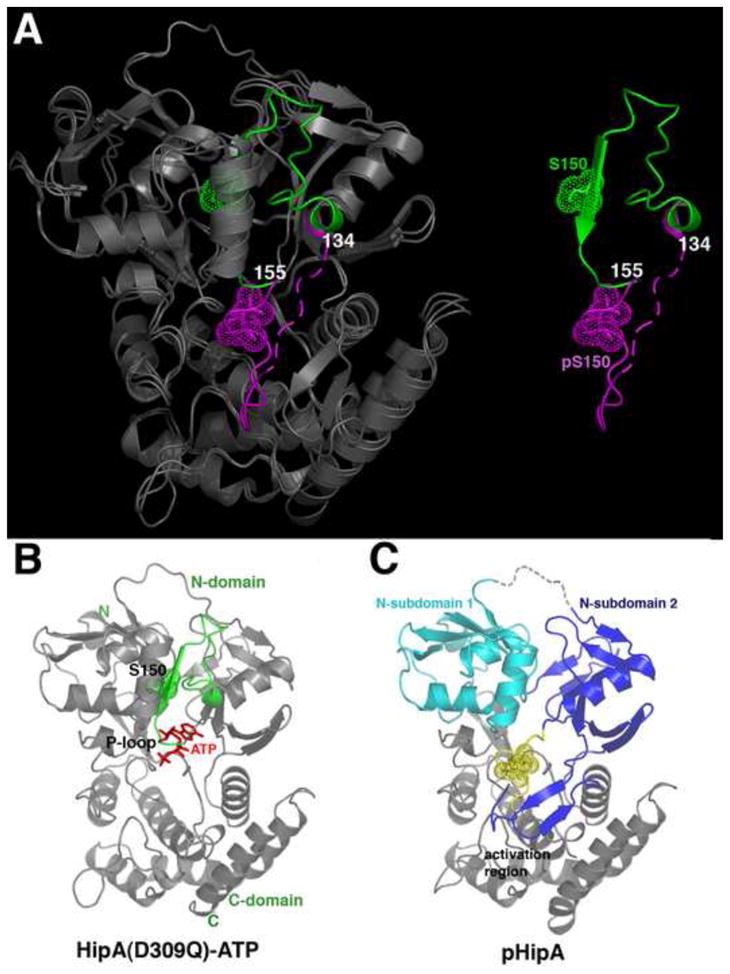
Figure 1. Extrusion of the P-loop motif of Ser150-phosphorylated HipA (pHipA).

(A) Superimposition of HipA(D309Q) and pHipA. (Left) The structures are shown as ribbons and colored grey except for their P-loop motifs, which are green in HipA(D309Q) and magenta in pHipA. (Right) Only the P-loop motifs are shown to underscore the dramatic conformational change resulting from the ejection of the P-loop motif from the protein core. Phosphorylated Ser150 (pS150) and Ser150 (S150) are shown as dotted spheres. Residues 134 and 155 are also labelled for reference.
(B) Ribbon diagram of the HipA(D309Q)-ATP structure (PDB code, 3DNU) (Schumacher et al, 2009). The P-loop motif is colored green and ATP is shown as red sticks.
(C) Ribbon diagram of pHipA in the same orientation as Figure 1B highlighting the separate N-subdomains (colored cyan and blue) and folded activation region that are created by P-loop motif ejection. pS150 is shown as dotted yellow spheres.
