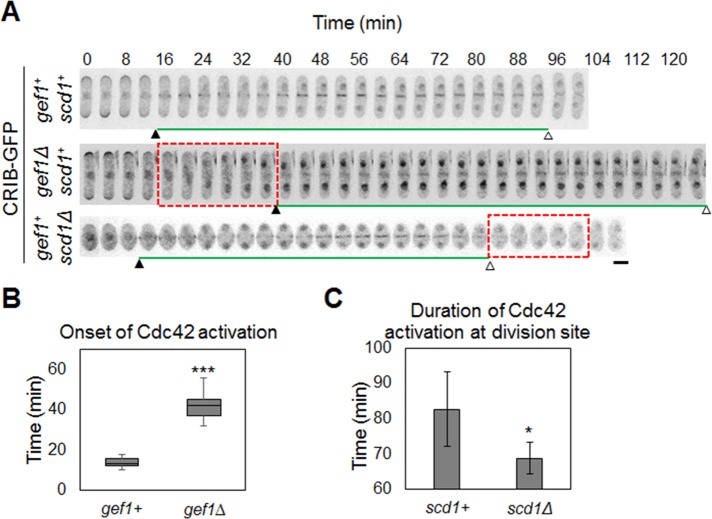
FIGURE 2:
Cdc42 activation pattern during cytokinesis. (A) Time-series images of CRIB-3xGFP signals during cytokinesis in the indicated cells. Black arrowheads indicate the appearance of CRIB-3xGFP at the site of cell division, and white arrowheads indicate the end of the CRIB-3xGFP signal at the site of cell division. Red box, absence of Cdc42 activation. n > 10. Bar, 5 μm. (B) Quantification of onset of Cdc42 activation cells as indicated (***p < 0.001). (C) Quantification of duration of Cdc42 activation in cells as indicated (*p < 0.05). Error bar, SD. Time is in minutes.

