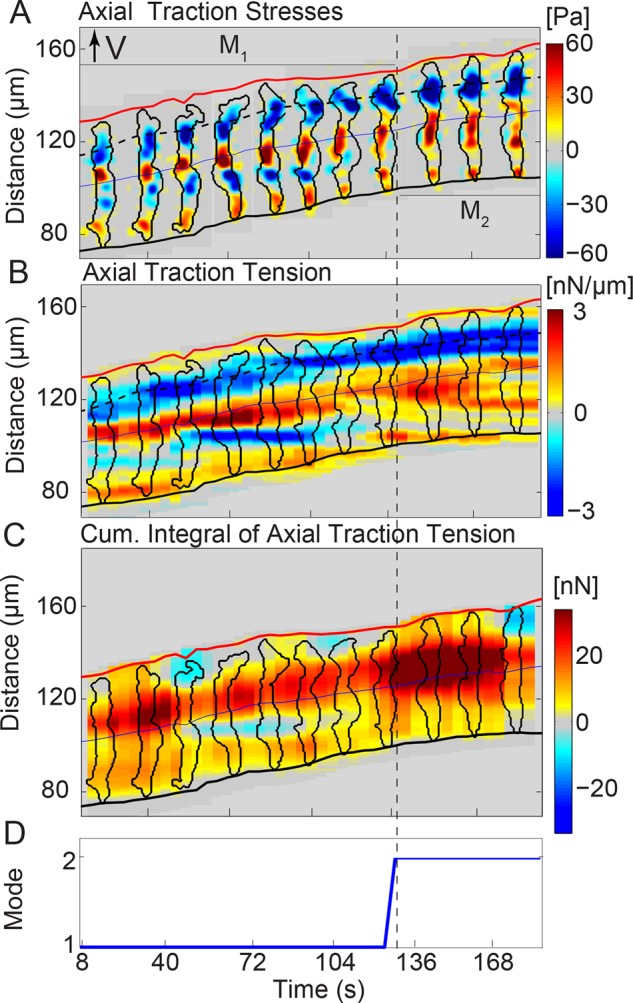
FIGURE 2:

Tandem wild-type pairs migrate by switching between two motility modes with distinct TA dynamics. Spatiotemporal kymographic representation of the axial stresses (A), axial traction tension (Tx; B), and cumulative integral of the axial tension along the cell pair length (Kx; C) as a function of the position along the pair’s trajectory and time. At any given instant of time, the centroid of the pair is displaced vertically according to its motion, so that the pair is moving from bottom to top. The blue line indicates the centroid of the pair, which coincides roughly with the border between the two cells. The inclined red and black lines indicate the instantaneous positions of the front and back pair edges. The black contours are the pair outlines, shown every 16 s. In B, the color map represents Tx in nanonewtons/micrometer plotted every 4 s. The dashed black line shows the location of the minimum traction tension at the leading cell’s front. Red or blue patches represent positive or negative values of Tx, respectively, and correspond to tensions aligned with the direction of the pair’s motion or pointing in the opposite direction. In C, Kx tracks whether the pair forms one contractile dipole (three TAs, one red patch in the Kx kymograph) or two (four TAs, two red patches in the Kx kymograph). (D) On the basis of the number of red patches (local maxima), one can categorize the pair’s TA dynamics into two modes: the pair migrates forming two contraction units (mode 1) or one (mode 2). The dashed vertical lines indicate the respective modes 1 and 2 (M1, M2; see also Supplemental Figure S1).
