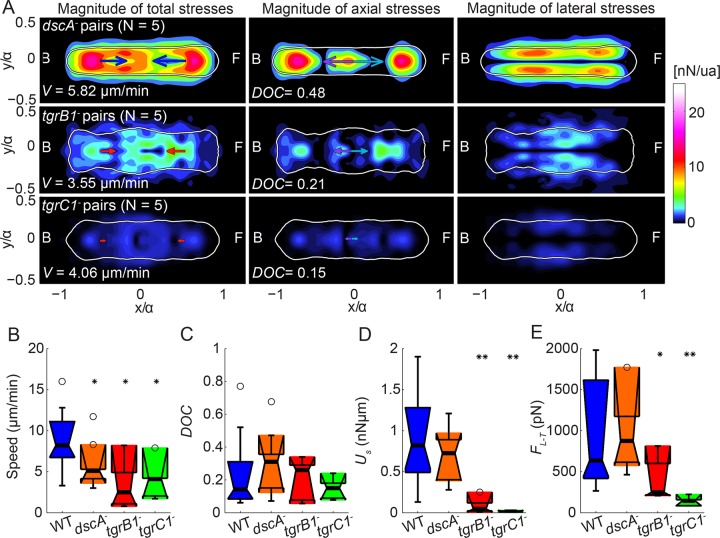
FIGURE 7:
dscA−, tgrC1−, and tgrB1− cell pairs migrate more slowly than wild type. (A) Average traction stress maps (nanonewtons/unit area) in the pair-based reference frame for dscA− (top; N = 5), tgrB1− (middle; N = 5), and tgrC1− (bottom; N = 5) cell pairs. Right, middle, left: magnitude of total, axial, and lateral traction stresses, respectively. The color patches indicate the magnitude of the stresses. Blue or red arrows indicate the mean net axial force generated by each cell of the pair, assuming the contact line between cells is in the middle of the pair. Purple and cyan arrows indicate the mean force exerted by the leading cell on the trailing cell and vice versa. The white contours show the average shape of the pairs. Front (F) and back (B) of the pairs are indicated. Average speed (V) and DOC. (B–E) Boxplots of motility parameters corresponding to wild-type (blue; N = 14), dscA− (orange; N = 5), tgrB1− (red; N = 5), and tgrC1− (green, N = 5) pairs. (B) Speed of migration (V). (C) DOC between the cells’ pairs. (D) Total strain energy imparted by the pairs (Us). (E) Intercellular force (FLT). Circles represent outliers, and the notched section of the boxplots shows the 95% confidence interval around the median (Wilcoxon–Mann–Whitney test). One or two asterisks denote statistically significant differences between the medians of two distributions (<0.05 or <0.01, respectively; Wilcoxon rank sum test; see also Supplemental Figures S5–S7).

