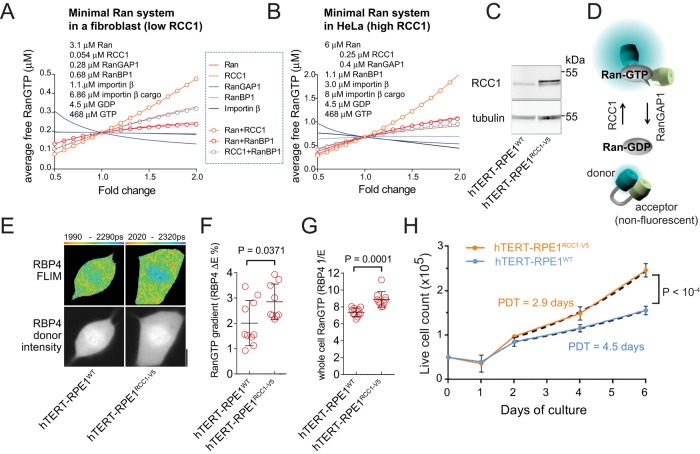
FIGURE 1:
RCC1-dependent increase in Ran⋅GTP accelerates the cell cycle. (A and B) Changes in cellular Ran⋅GTP concentration analyzed by computational models of the minimal Ran system in a fibroblast-like cell (A) and a HeLa-like cell (B). (C) Immunoblots of RCC1 in the hTERT-RPE1WT and hTERT-RPE1RCC1-V5 cell lysates. (D) Schematic of the RBP-4 FRET sensor for Ran⋅GTP detection with FLIM. The binding of Ran⋅GTP to RBP-4 increases the donor–acceptor distance, resulting in a longer donor fluorescence lifetime, τdonor. (E) Detection of mitotic Ran⋅GTP gradients in hTERT-RPE1WT and hTERT-ΔRPE1RCC1-V5 cells, using FLIM with RBP-4. The top row shows the donor intensity images and the bottom row shows the pseudocolor FLIM images. The range of the displayed values (corresponding to τdonor values) is indicated beneath the FLIM panels. Scale bar: 10 μm. (F) Scatter plot of the mitotic Ran⋅GTP gradients quantified as the difference between the cytoplasmic and chromatin E in each cell (ΔE; single-cell data; means ± SD; t test). (G) Scatter plot of the inverse of the average cellular RBP-4 E, which is proportional to Ran⋅GTP concentration (E−1; single-cell data; means ± SD; t test). (H) Cell number in cultures of hTERT-RPE1WT and hTERT-RPE1RCC1-V5 cells grown in parallel. Means ± SD from two experiments performed in triplicate were fitted with exponential growth equations after 2 d from the start of culture (dashed lines) to calculate the PDT. The null hypothesis was tested: one curve for both data sets.

