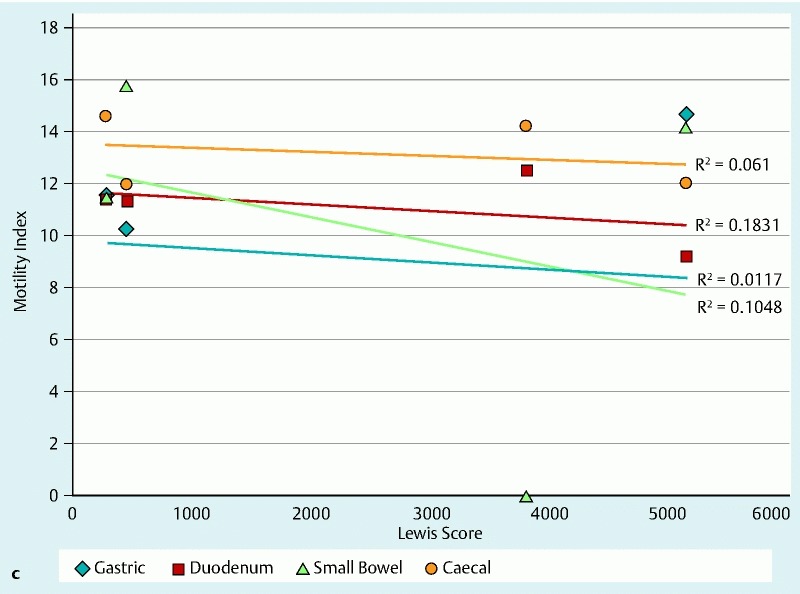
Fig. 6a (see above) Distribution of WBTT, FC and LS for patients in our study for whom the relevant data sets were available. Each plot point represents a patient in our study with the numbers corresponding to patient numbers in Table 3. Abbreviations: FC, fecal calprotectin; LS, Lewis score; WBTT, whole bowel transit time b Linear regression of FC against motility indices for patients in our study for whom the relevant data sets were available. c Linear regression of LS against motility indices for patients in our study for whom the relevant data sets were available.

