Fig. 11.

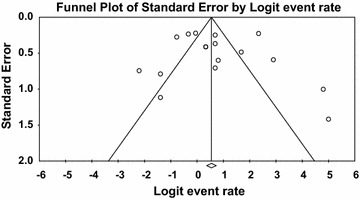
Funnel plot of prevalence of V. parahaemolyticus in oyster. Solid vertical line represents the summary prevalence rate derived from fixed-effect meta-analysis while the diagonal lines represent 95 % confidence interval

Funnel plot of prevalence of V. parahaemolyticus in oyster. Solid vertical line represents the summary prevalence rate derived from fixed-effect meta-analysis while the diagonal lines represent 95 % confidence interval