
Fig. 2.
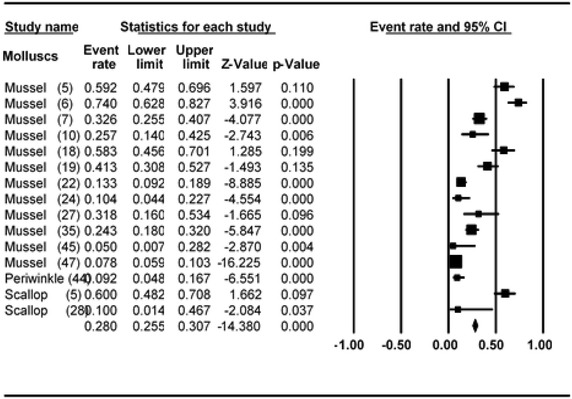
Forest plots of prevalence of V. parahaemolyticus in mussel, scallop and periwinkle for fixed effects meta-analyses. (Squares represent effect estimates of individual studies with their 95 % confidence intervals of prevalence with size of squares proportional to the weight assigned to the study in the meta-analysis)