. 2016 Mar 30;34(1):64–75. doi: 10.3857/roj.2016.34.1.64

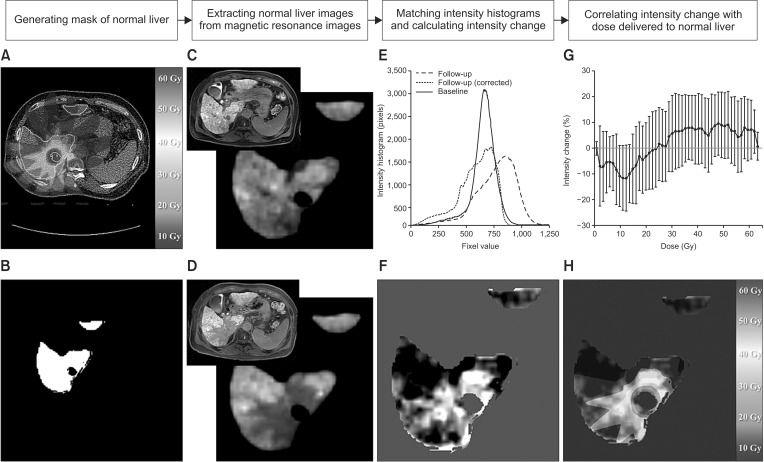
Fig. 1. A brief scheme illustrating the threshold dose calculation and the relationship between dose and change in signal intensity. (A) Treatment plans which consist of planning computed tomography, contour, and dose. (B) A generated normal liver mask. (C, D) Extracted normal liver regions on pretreatment and follow-up magnetic resonance images (MRIs), respectively. (E) Intensity histograms of signal intensity in normal liver from pretreatment MRI (blue), follow-up MRI (green), and histogram matched follow-up MRI (red). (F) A map of intensity change. (G) An example of the relationship between dose and intensity change. (H) A map of intensity change overlaid with dose.

Fig. 1