. 2016 Mar 30;34(1):64–75. doi: 10.3857/roj.2016.34.1.64

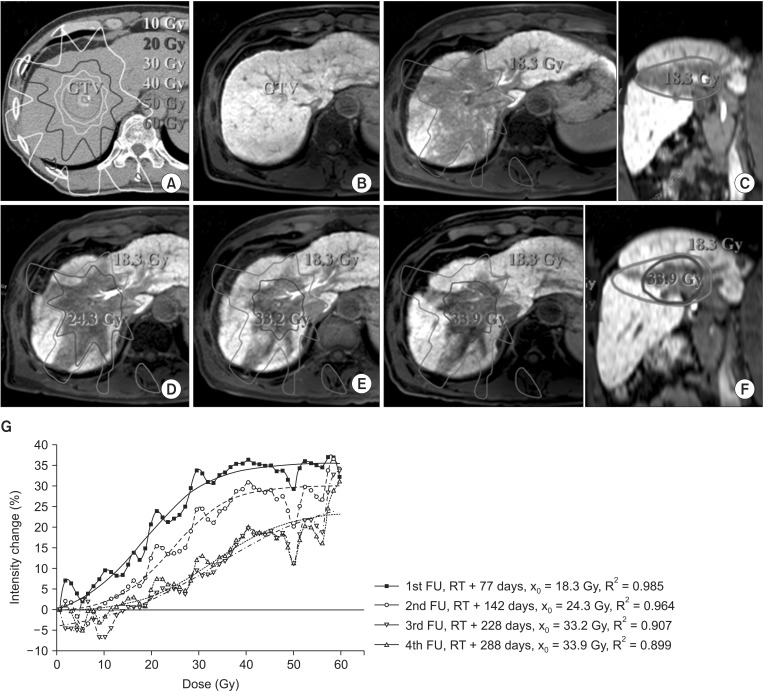
Fig. 4. Treatment plan and change in the focal liver reaction region on consecutive follow-up magnetic resonance image (MRI) scans for the patient #3. (A) Planning computed tomography image with isodose lines. (B) Pretreatment MRI acquired 44 days before SABR. (C-F) Consecutive follow-up MRI acquired 77, 142, 228, and 288 days after SABR, respectively. Isodose lines represent the threshold dose calculated from the first follow-up MRI (18.3 Gy, red) and each follow-up MRI. (G) Relationships between dose and normal liver and intensity changes from consecutive follow-up MRIs. GTV, gross tumor volume; SABR, stereotactic ablative body radiotherapy; FU, follow-up; RT, radiotherapy.

Fig. 4