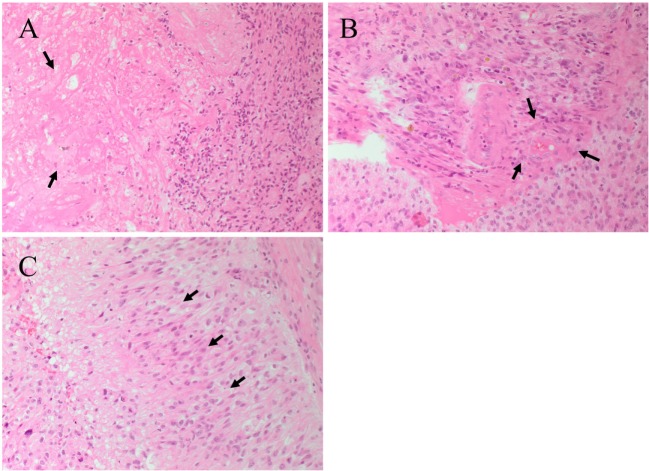
Figure 2.
Hematoxylin and eosin staining of a glioblastoma multiforme. (A) The interface between tumor cells and the area of necrosis. The necrotic area (arrows) show greatly reduced nuclear staining. (B) Proliferation of the endothelial cells (arrows) within a microvessel. (C) Palisading cells (arrows) around the necrotic area. Original magnification: 200×.

