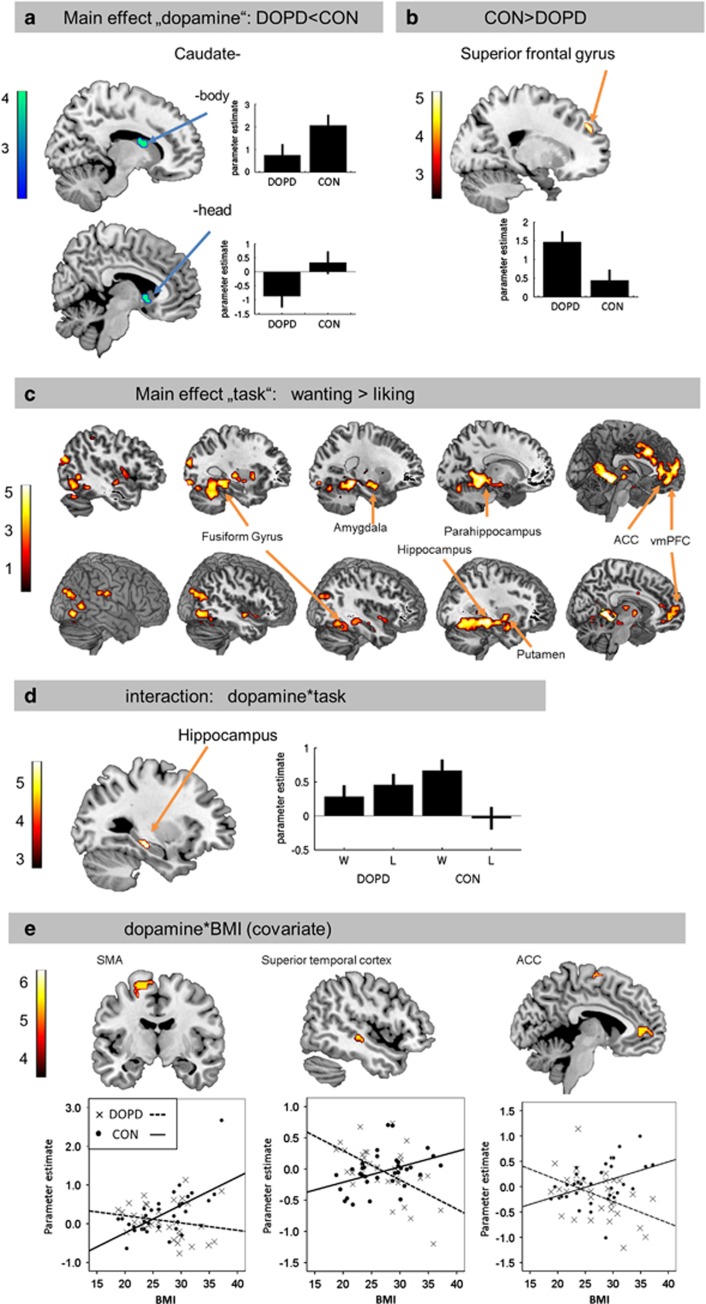
Figure 3.
Brain activation pattern superimposed on an anatomical brain and thresholded with P<0.001 by way of illustration. (a) Lower activation in striatal regions (caudate head and body) in the depleted state. Results are significant with P<0.05 family-wise error small volume corrected. (b) Higher activation in the superior frontal gyrus in the depleted state. (c) Activation differences between the wanting and liking task in 5 consecutive sagittal slices for each hemisphere (upper row: left hemisphere, lower row: right hemisphere). Each brain region that is more activated in the wanting than in the liking task is labeled one-time exemplary. (d) Interaction-effect dopamine × task in the hippocampus. (e) Interaction-effect dopamine × BMI (covariate) in the supplementary motor area, superior temporal gyrus, and the anterior cingulate cortex. The color bars represent T-values. If not otherwise stated, results are significant with P<0.05 family-wise error-corrected. L, liking; W, wanting.

