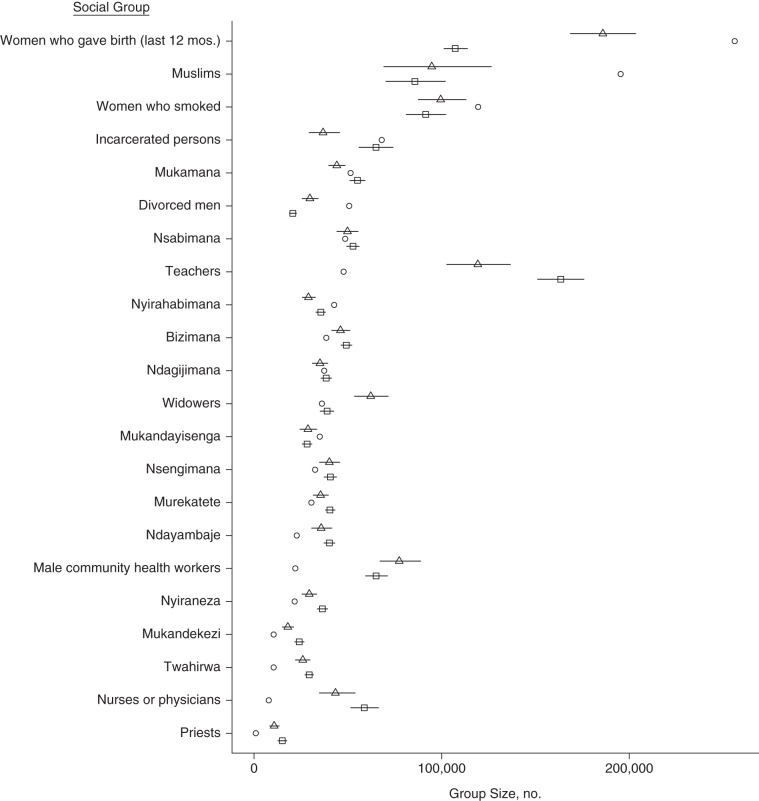
Figure 3.
Results from internal consistency checks for the 22 social groups of known size (Table 2) and for the meal tie definition (triangles) and the acquaintance tie definition (squares) of social ties as compared with the true size of each group (circles), Rwanda, 2011. For most of the groups of known size, the internal consistency estimates from both tie definitions are close to the true value. However, the uncertainty intervals—which only capture sampling error—do not include the truth as often as would be expected, a pattern consistent with other scale-up studies (8).

