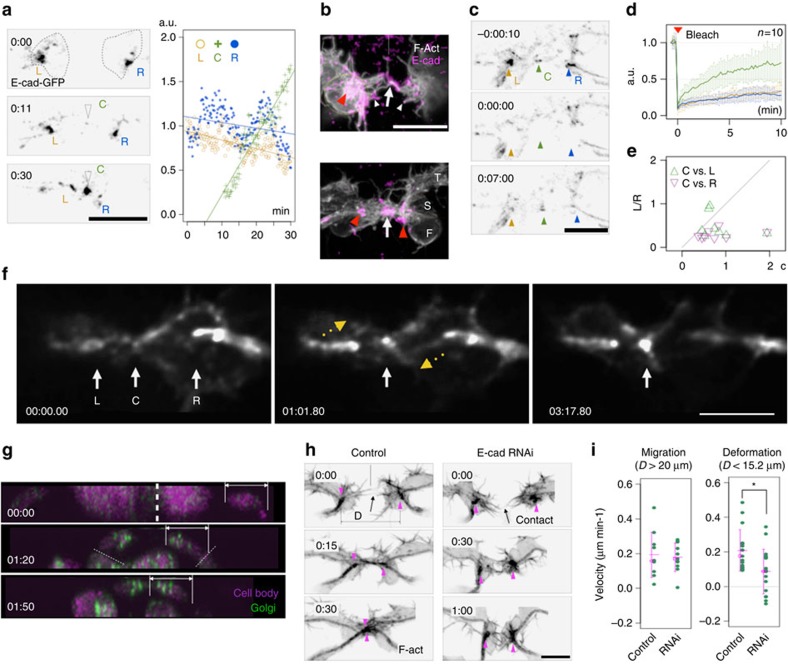
Figure 2. E-cadherin accumulation and trafficking.
(a) E-cadherin accumulation during formation of the cell junction (C) between FCs is shown by time-lapse movie (left) and by quantification of the accumulated E-cadherin-GFP (right). L and R, left and right FC–stalk boundaries. (b) E-cadherin accumulated at two sites in FC filopodia: in FCs making contact (arrow) and at the tip of forward-extending filopodia (white arrowheads). Red arrowhead, FC–stalk boundary; S, stalk cell; T, terminal cell. FRAP analysis (c) and quantification (d) of E-cadherin-GFP accumulation. Error bar indicate s.d. (e) A scatter plot of C versus L/R signals (Fc) after recovery showing the preferential addition of E-cadherin-GFP to the newly forming junction between FCs. (f) Intracellular E-cadherin-GFP trafficking: the GFP signal accumulated progressively in the FC contact site (C, white arrow) over a period of ∼3 min. Yellow arrows in the central panel show cytoplasmic E-cadherin-GFP streaming towards the plasma membrane. (g) Relocalization of the Golgi apparatus to the front end of FCs during new junction formation, visualized by imaging Grasp65-GFP driven by esg_FC_Gal4. (h) RNAi inhibition of de novo E-cadherin synthesis interfered with branch fusion. (i) Velocity measurements demonstrated that branch migration before branch contact was normal, but the cell deformation after contact was significantly delayed in the E-cadherin RNAi embryo (*Student's t-test, P<0.05). Scale bar, 10 μm.

