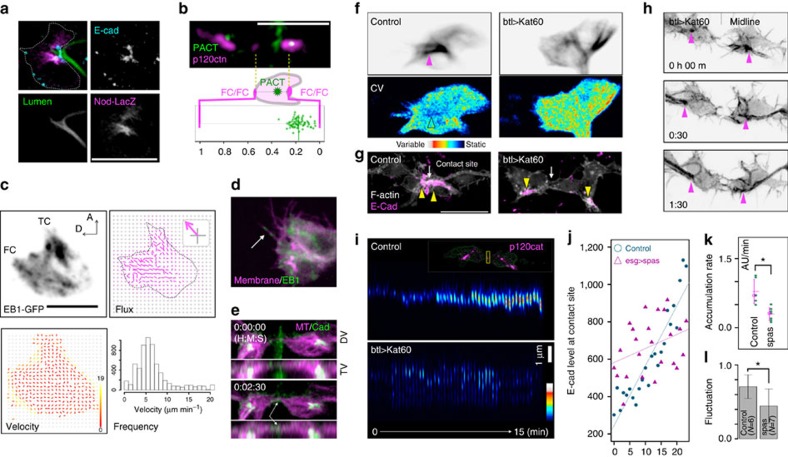
Figure 4. Microtubule dynamics in FCs.
(a) The polarization of FC microtubules during migration. The FC is outlined with a dotted line. The microtubule minus-end marker Nod-LacZ was concentrated at the FC–stalk cell boundary, which was marked with E-cadherin and lumen (chitin) staining. (b) The centriole marker GFP-PACT localized near the FC–stalk cell boundary; the lower panel shows the relative GFP-PACT localization along the axis connecting the FC–FC and FC–stalk cell boundaries during fusion. (c) Localization of the microtubule plus-end marker EB1-GFP and the flux and velocity distribution deduced by particle image velocimetry (PIV) analysis. (d) Multiple EB1-GFP comets entered a single filopodia. (e) E-cadherin-GFP accumulated on microtubule tracks at the FC contact site. (f) Kat60 destabilized the microtubule lattice in FCs. The distribution of tau-RFP (top, averaged for 20 frames of 10-s intervals) and its pixel-wise coefficient of variation in a 100-s period (bottom, averaged as in the top panel) are shown. (g) Kat60 inhibited E-cadherin accumulation at the FC contact site. (h) Kat60 inhibited tracheal-branch fusion. FCs contacted each other using filopodia, but did not form a stable adhesion interface. (i) Time course of p120ctn-RFP accumulation at the FC contact site. The region of interest (ROI) was set at the FC contact site (yellow box in inset); its intensity profile over a 15-min period is shown. (j) Time course of E-cadherin-GFP accumulation (arbitrary unit) in control and esg_FC-Gal4>Spas FCs. (k) The rate of E-cadherin-GFP accumulation. (l) Fluctuation of E-cadherin-GFP accumulation (R2 value). Error bar indicates s.d. Scale bar, 10 μm.

