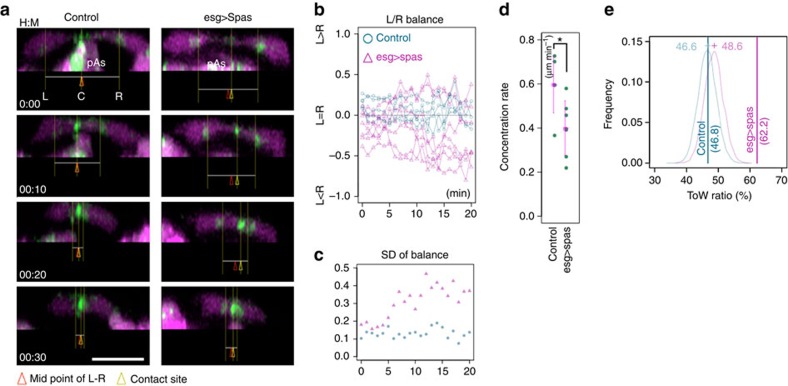
Figure 5. The balanced contraction of paired FCs depends on microtubules.
(a) Microtubule inhibition disrupted the balanced contraction: x–z views show FC pairs in control and Spas-expressing embryos (esg_FC-Gal4). Green, E-cadherin-GFP; magenta, tagRFP. Arrowheads and lines indicate cell-adhesion sites. (b) Plot of the L/R balance values. Spas expression caused greater deviations from a balanced condition, which was represented by a value of 0. The onset of E-cadherin-GFP accumulation at the FC–FC interface was set as 0 min in the time series of each embryo. (c) Fluctuations in contraction: the s.d. of the L/R balance value was plotted against time. (d) A contraction rate plot based on the L–R length decrease (*Student's t-test, P<0.05). (e) Evaluation of ToW conditions: vertical bars indicate the frequency of contraction/relaxation in FC pairs for each time interval measured in the two genotypes. Curves indicate the simulated distribution of numerically calculated frequencies of paired contraction/retraction events, assuming that contraction and retraction occur randomly in each FC (10,000 trials). The value calculated for control FCs was slightly smaller than that for Spas-expressing FCs due to the difference in contraction rate (d). The ToW value for Spas-expressing FCs (62.2%) was far greater than the value expected from the random hypothesis, suggesting that uncoordinated contraction/retraction events occurred more frequently in the FCs expressing Spas. Scale bar, 10 μm.

