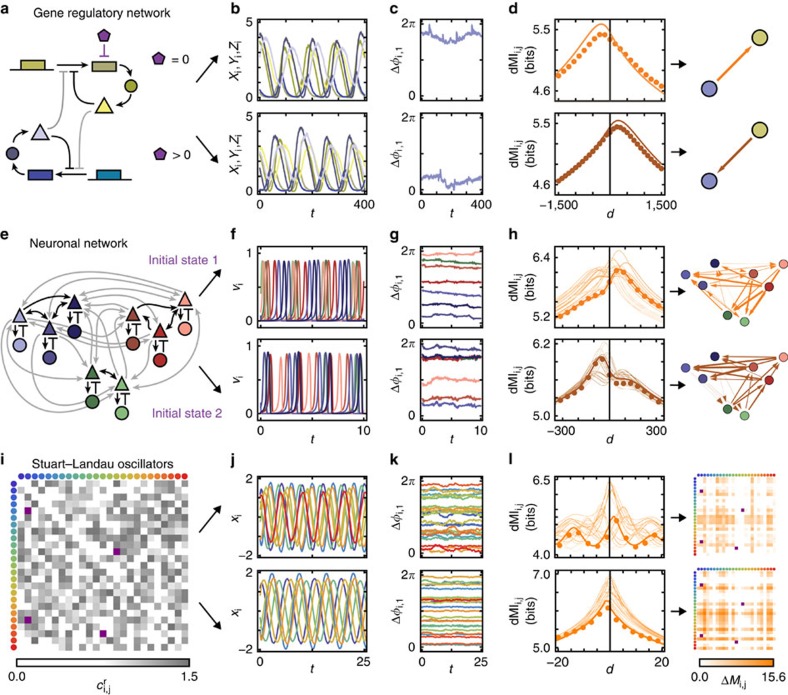
Figure 1. Flexible information routing across networks.
(a) Simple model of a gene-regulatory network of two coupled biochemical oscillators of Goodwin type (yellow and blue). An additional molecule (purple) degrades the transcribed mRNA in one of the oscillators and thereby changes its intrinsic frequency. Coupling strengths are gray coded (darker colour indicates stronger coupling), sharp arrows indicate activating and blunt arrows inhibiting influences (cf. Methods). (b) Stochastic oscillatory dynamics of the concentrations of the systems components xi (mRNA), yi (enzyme), and zi (protein), i∈{1, 2}. (c) Fluctuations of the phases extracted from the full dynamics relative to a reference unit. (d) dMI (dMI1,2) between the phase signals. The numerical data (dots) agrees well with the theoretical prediction (4) (solid lines). The asymmetry in the dMI curves around d=0 indicates a directed information sharing pattern summarized in the graphs (right). Arrow thickness indicates the strength of directed information sharing ΔMIi,j measured by the positively rectified differences of the areas below the dMIi,j(d) curve for d<0 and d>0. (e–h) Same as in a–d but for a modular network of coupled neuronal sub-populations consisting each of excitatory (triangle) and inhibitory (disk) populations (Wilson–Cowan-type dynamics) that undergo neuronal oscillatory activity (cf. Methods). For the same network two different collective dynamical states accessed by different initial conditions give rise to two different information sharing patterns (f–h top versus bottom). (f) Oscillatory activities vi of the N=8 excitatory populations i. (i–l) As in a–d but for generic oscillators close to a Hopf bifurcation (Stuart–Landau oscillators) each described by two-dimensional normal-form coordinates (xi,yi) connected to a larger network of N=25 oscillators with coupling coefficients ci,jr (cf. Methods). In i and l, connectivity matrices are shown instead of graphs. Two different network-wide IRPs arise (top versus bottom in j–l) by changing a small number of connection weights (purple entries in i and l).

