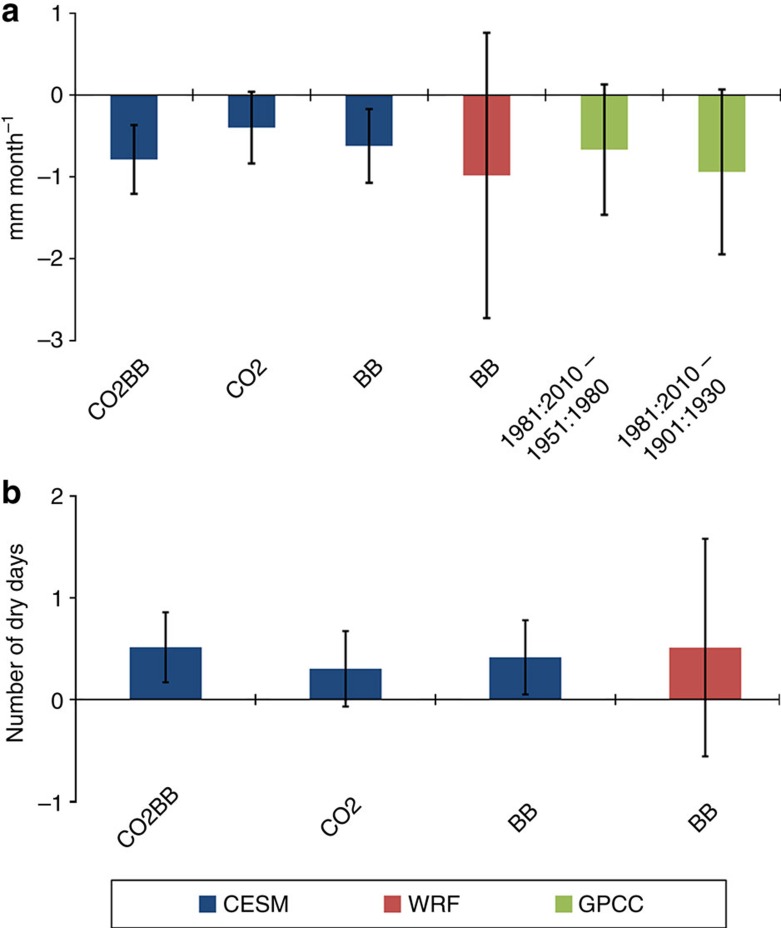
Figure 2. Southern Africa average change in precipitation.
Change in mean precipitation (mm month−1) (a) and number of dry days (b) over the June to September season within the subregion (region indicated by dashed rectangle in Fig. 1) for various model experiments. Model results are shown as differences from the BASE simulation, where CESM denotes the global climate model and WRF the regional model. GPCC observations are both shown as the difference 1981:2010−1901:1930 and 1981:2010−1951:1980. Error bars show the 95% confidence interval derived from a two-tailed Student's t-test.

