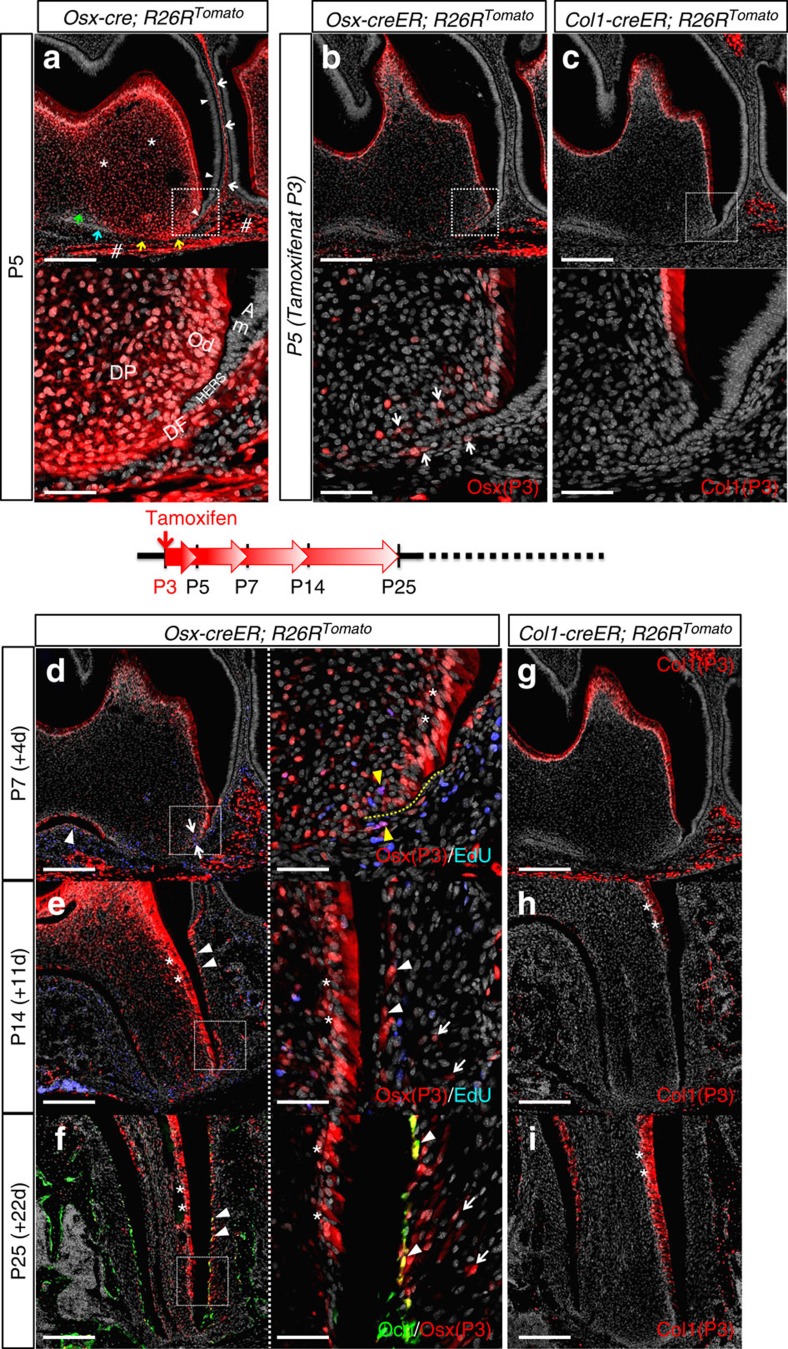
Figure 2. Mesenchymal progenitors of dental root-forming cells express osterix (Osx).
(a–c) P5 mandibular first molar (M1) sections of (a) Osx-cre; R26RTomato, (b) Osx-creER; R26RTomato (tamoxifen at P3) and (c) Col1-creER; R26RTomato (tamoxifen at P3) mice were stained for nuclei. Upper panels: confocal images of the distal root, lower panels: magnified views of the dotted areas. Red: tdTomato, grey: DAPI. In (a), white arrows: dental follicle, white arrowheads: ameloblasts and epithelial root sheath, asterisks: dental papilla, sharps: alveolar bone, yellow/blue arrows: Tomato− dental follicle, green arrows: Tomato− dental papilla. DP: dental papilla, DF: dental follicle, Od: odontoblasts, Am: ameloblasts. In (b), arrows: dental papilla and follicle cells surrounding HERS. Scale bars: 200 μm (upper panel) and 50 μm (lower panel). (d,e) Osx-creER; R26RTomato mice received 0.1 mg tamoxifen at P3 and were analyzed at P7 (d) and P14 (e). EdU was administered twice (6 and 3 h) prior to analysis. M1 sections were stained for nuclei and EdU. Left panels: confocal images of the distal root, right panels: magnified views of the dotted areas. Red: tdTomato, grey: DAPI, blue: EdU-Alexa647. In (d), white arrows: red cells surrounding HERS, white arrowhead: red cells in the interradicular area, yellow dotted line: HERS, yellow arrowheads: EdU+ red cells. In (e), arrowheads: cementoblasts, asterisks: odontoblasts, arrows: PDL cells. Scale bars: 200 μm (left panel) and 50 μm (right panel). (f) Oc-GFP; Osx-creER; R26RTomato mice received 0.1 mg tamoxifen at P3 and were analyzed at P25. M1 sections were stained for nuclei. Left panel: a confocal image of the distal root, right panel: a magnified view of the dotted area. Green: EGFP, red: tdTomato, grey: DAPI. Arrowheads: Oc-GFP+ cementoblasts, asterisks: odontoblasts, arrows: PDL cells. Scale bars: 200 μm (left panel) and 50 μm (right panel). (g–i) Col1-creER; R26RTomato mice received tamoxifen at P3 and were analyzed at P7 (g), P14 (h) and P25 (i). M1 sections were stained for nuclei. Red: tdTomato, grey: DAPI. Asterisks: odontoblasts. Scale bars: 200 μm.

