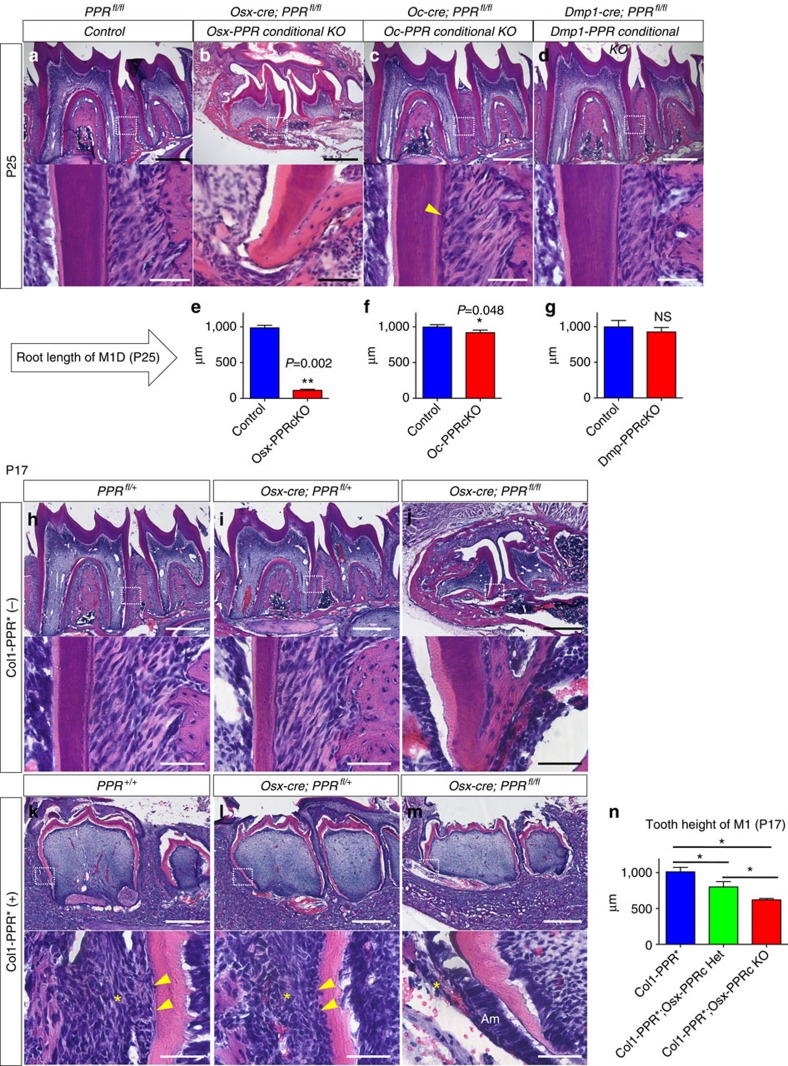
Figure 6. PPR in differentiated matrix-producing cells is dispensable for tooth root formation.
(a–d) Mandibular first molar (M1) sections of (a) Control (PPRfl/fl), (b) Osx-PPR conditional KO (Osx-cre; PPRfl/fl), (c) Oc-PPR conditional KO (Oc-cre; PPRfl/fl) and (d) Dmp1-PPR conditional KO (Dmp1-cre; PPRfl/fl) mice at P25 were stained for hematoxylin and eosin. Lower panels: magnified views of the dotted areas. Yellow arrowhead: embedded cementocyte. Scale bars: 500 μm (upper panels) and 50 μm (lower panels). (e–g) Shown is quantification of M1 distal root length at P25. Blue bars: Control, red bars: (e) Osx-PPR conditional KO, (f) Oc-PPR conditional KO and (g) Dmp1-PPR conditional KO mice. Control: n=3–6 per group, conditional KO: n=6–7 per group, *P<0.05, **P<0.01, Mann–Whitney's U-test. (h–m) M1 sections of (h) PPRfl/+, (i) Osx-cre; PPRfl/+, (j) Osx-cre; PPRfl/fl, (k) Col1-PPR*; PPR+/+, (l) Col1-PPR*; Osx-cre; PPRfl/+ and (m) Col1-PPR*; Osx-cre; PPRfl/fl molars at P17 were stained for hematoxylin and eosin. Lower panels: magnified views of the dotted areas. Arrowheads: cementoblasts, asterisks: PDL/dental follicle. Scale bars: 500 μm (upper panels) and 50 μm (lower panels). (n) Shown is quantification of M1 tooth height at P17. Blue bars: Col1-PPR* Control, green bars: Col1-PPR*; Osx-PPR conditional Het, red bars: Col1-PPR*; Osx-PPR conditional KO. n=4–5 per group, *P<0.05, Mann–Whitney's U-test. All data are represented as mean±s.d.

