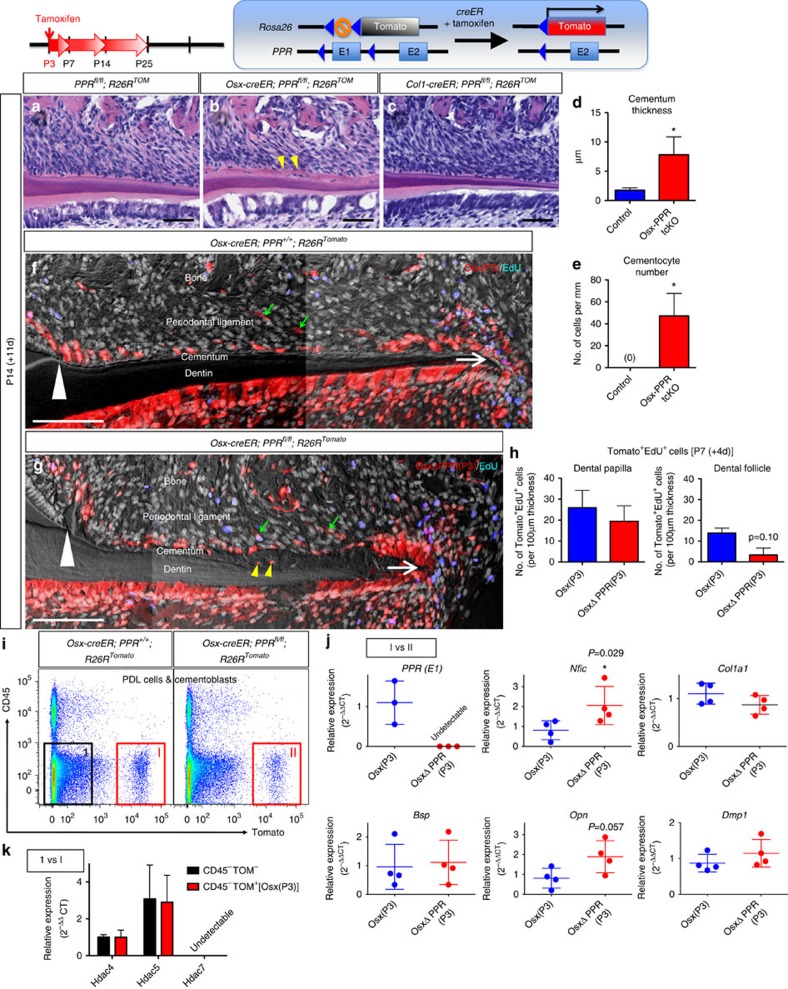
Figure 7. PPR orchestrates cementoblast differentiation of osterix-expressing progenitors.
(a–c) PPRfl/fl; R26RTomato (a), Osx-creER; PPRfl/fl; R26RTomato (b) and Col1-creER; PPRfl/fl; R26RTomato (c) mice received tamoxifen at P3 and were analyzed at P14. Mandibular first molar (M1) sections were stained for hematoxylin and eosin, and crown is on the left. Yellow arrowheads: cellular cementum. Scale bars: 50 μm. (d,e) Shown is quantification of M1 distal root cementum thickness (d) and cementocyte number (e) at P14 (tamoxifen at P3). Blue bars: Control (PPRfl/fl; R26RTomato), red bars: Osx-PPR tcKO (Osx-creER; PPRfl/fl; R26RTomato). n=4 per group, *P<0.05, Mann–Whitney's U-test. (f,g) Osx-creER; PPR+/+; R26RTomato (f) and Osx-creER; PPRfl/fl; R26RTomato (g) mice received tamoxifen at P3 and were analyzed at P14. EdU was administered twice (6 and 3 h) prior to analysis. M1 sections were stained for nuclei and EdU. Blue: EdU-Alexa647, red: tdTomato, grey: DAPI and DIC. White arrowheads: cementoenamel junction, white arrows: apex, green arrows: Tomato+ PDL cells, yellow arrowheads: Tomato+ embedded cementocytes. Scale bars: 100 μm. (h) Shown is quantification of Tomato+EdU+ cells in dental papilla (left panel) and dental follicle (right panel) around HERS at P7 (tamoxifen was injected at P3). Blue bars: EdU+Osx(P3) (Osx-creER; PPR+/+; R26RTomato) cells, red bars: EdU+OsxΔPPR(P3) (Osx-creER; PPRfl/fl; R26RTomato) cells. Double positive cells were counted on 10–15 serial confocal sections of each molar. n=3 per group. (i–k) Osx-creER; PPR+/+; R26RTomato (f) and Osx-creER; PPRfl/fl; R26RTomato (g) mice received tamoxifen at P3 and molars (M1, M2) were extracted at P25. Collagenase-digested PDL cells and cementoblasts were stained for CD45 and subjected to FACS analysis. (i) A representative FACS plot of FSC/SSC-gated singlets. Left panel: cells from Osx-creER; PPR+/+; R26RTomato, right panel: cells from Osx-creER; PPRfl/fl; R26RTomato. X axis: tdTomato, Y axis: CD45. Fraction [1]: CD45−Tomato− PPR+/+, [I]: CD45−Tomato+PPR+/+ and [II]: CD45−Tomato+ΔPPRfl/fl was sorted to isolate RNA. (j) mRNA expression levels of PPR (E1), Nfic, Col1a1, Bsp, Opn and Dmp1 in fraction [I] and [II] determined by qPCR. (k) mRNA expression levels of Hdac4, Hdac5 and Hdac7 in fraction [1] and [I] determined by qPCR. All data were normalized to β-actin (Actb). n=3–4 per group, *P<0.05, Mann–Whitney's U-test. All data represented as mean±s.d.

