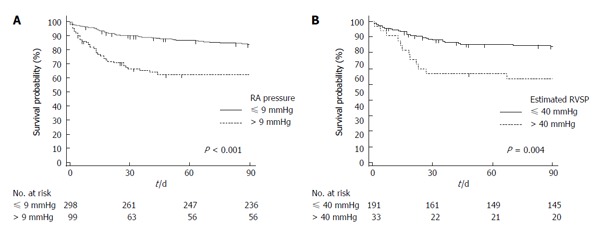
Figure 3.

Kaplan-Meier analysis of three-month survival after transjugular portosystemic shunts. A: Stratified by RA pressure > 9 mmHg vs ≤ 9 mmHg; B: Stratified by estimated RVSP pressure > 40 mmHg vs ≤ 40 mmHg. The separation in survival curves in both panels is particularly noted during the first month. P values are provided by log-rank test. RVSP: Right ventricular systolic pressure; RA: Right atrium.
