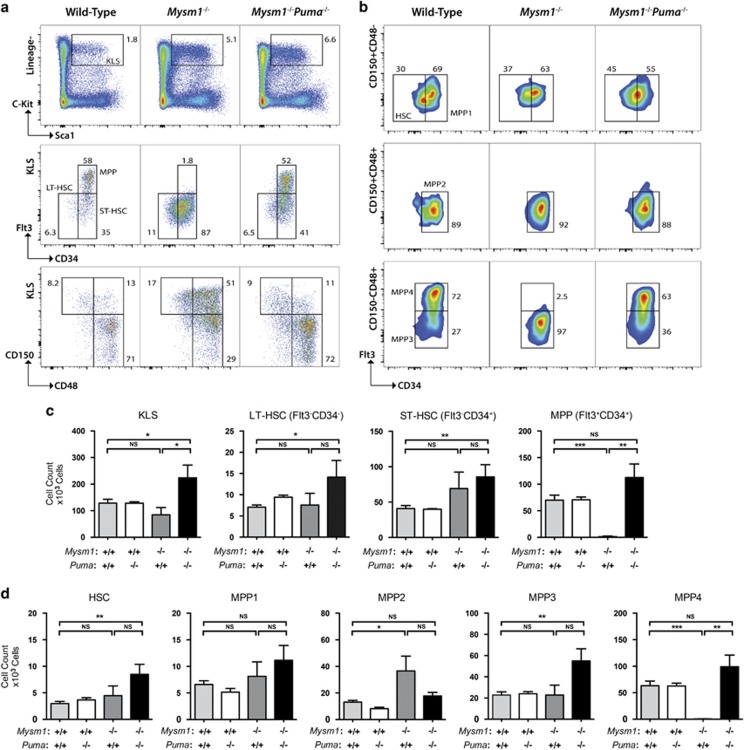
Figure 5.
Bbc3/PUMA deletion rescues the MPP cell deficiency of Mysm1-knockout mice. (a) Representative flow cytometry plots showing Lin−cKit+Sca1+ (KLS) HSPCs within the bone marrow of wild-type, Mysm1−/−, and Mysm1−/−Puma−/− mice (top panel) and further characterizing these cells based on the expression of CD34 and Flt3 markers (middle panel), or CD150 and CD48 markers (bottom panel). (b) Representative flow cytometry plots of the bone marrow from wild-type, Mysm1−/−, and Mysm1−/−Puma−/− mice gated on Lin−cKit+Sca1+ KLS cells and showing HSCs (CD150+CD48−CD34−Flt3−, top panel), MPPs MPP1 (CD150+CD48−CD34+Flt3−, top panel), MPP2 (CD150+CD48+CD34+Flt3−, middle panel), MPP3 (CD150−CD48+CD34+Flt3−, bottom panel), and MPP4 (CD150−CD48+CD34+Flt3+, bottom panel) cell populations. (c) Absolute cell counts of long-term stem cells (LT-HSCs, KLS CD34−Flt3−), short-term stem cells (ST-HSCs, KLS CD34+Flt3), and MPPs (KLS CD34+Flt3+). (d) Absolute cell counts of HSC, and MPP1–4 populations, as defined in Figure 5b. Bars represent mean±S.E.M.; *P<0.05, **P<0.01, ***P<0.001, NS, nonsignificant using Student's t-test. Bone marrow cell numbers are presented per two tibias and femurs. Data are from ≥4 mice per group and reproduced in at least two independent experiments

