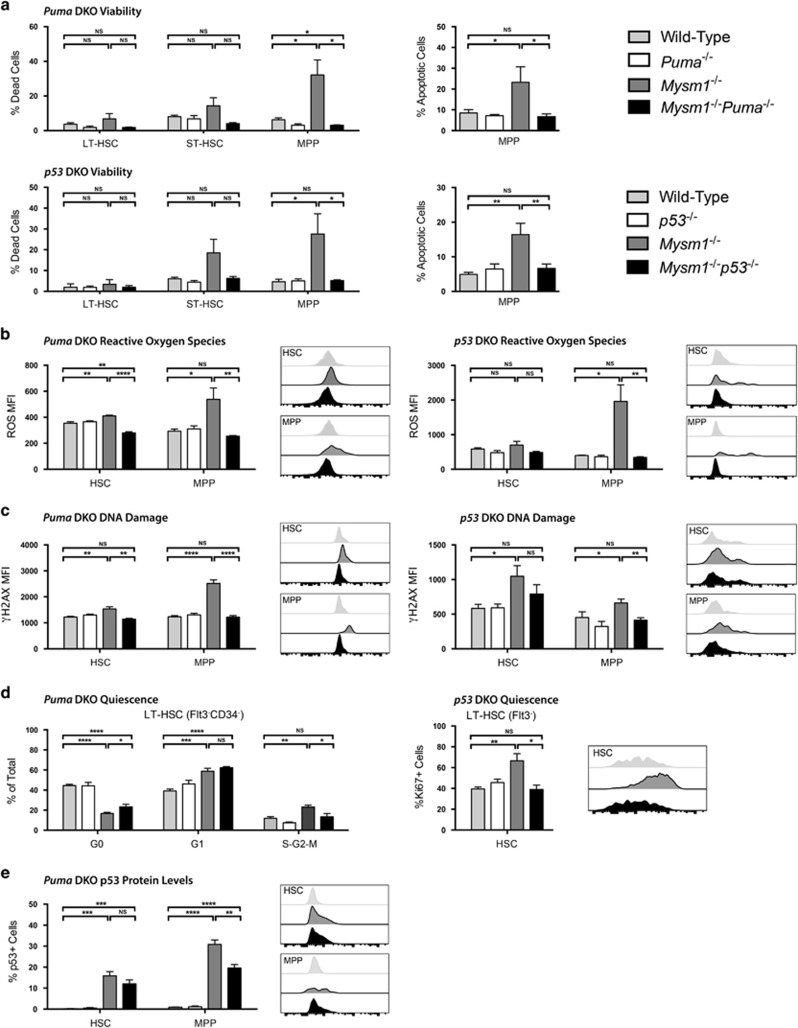
Figure 7.
p53 and PUMA as mediators of cell death and other stress phenotypes in Mysm1-deficient HSPCs. All data presented are either from Puma- double knockout (DKO) mice: wild-type (gray), Puma−/− (white), Mysm1−/− (charcoal), and Mysm1−/−Puma−/− (black); or from p53-DKO mice: wild-type (gray), p53−/− (white), Mysm1−/− (charcoal), and Mysm1−/−p53−/− (black). Cell gating was as follows: HSCs (Lin−cKit+Sca1+Flt3−) and MPPs (Lin−cKit+Sca1+Flt3+); or LT-HSCs (Lin−cKit+Sca1+Flt3−CD34−), ST-HSCs (Lin−cKit+Sca1+Flt3−CD34+) and MPPs (Lin−cKit+Sca1+Flt3+CD34+). (a) Cell death was assessed by the uptake of an amine-reactive fixable viability dye, and apoptosis was assessed with Annexin V staining. (b) Reactive oxygen species levels were quantified using the H2DCFDA dye. (c) DNA damage was measured by staining for γH2AX protein levels. (d) HSC quiescence for Puma-DKO mice was evaluated by staining for Ki67 protein levels and DNA content with 7-AAD (left panel) with G0 (Ki67− 2 N DNA), G1 (Ki67+ 2 N DNA), and S-G2-M (Ki67− >2 N DNA) phase shown. HSC quiescence for p53-DKO mice was evaluated by staining for Ki67 protein levels only (right panel) with G0 (Ki67−) and G1-S-G2-M (Ki67+) phases shown. (e) p53 levels in Puma-DKO mice were assessed using p53 antibody (1C12) staining. Data for viability and reactive oxygen species represent total cells; data for γH2AX, Ki67, and p53 represent live cells only. MFI is the mean fluorescence intensity; percentage of positive cells refers to cells with fluorescence intensity above FMO control levels. Histogram overlays show representative FACS plots of mice from wild-type, Mysm1−/−, and DKO groups only. Bars show the mean±S.E.M.; *P<0.05, **P<0.01, ***P<0.001, ****P<0.0001, NS nonsignificant using Student's t-test; data are from five to nine mice per group and are representative of at least two independent experiments

