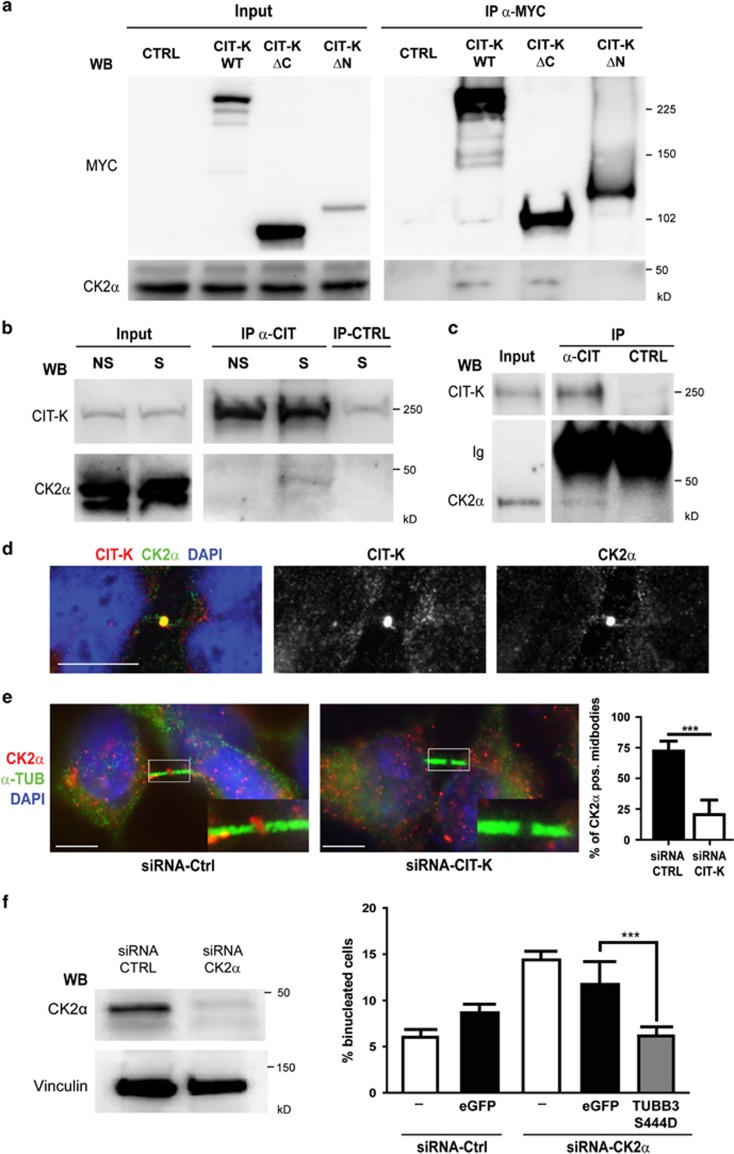
Figure 6.
Physical and functional interaction between CIT-K and CK2α upstream of TUBB3 S444 phosphorylation. (a) HeLa cells were transiently transfected with MYC-tagged CIT-K wild-type or mutant constructs. Overexpressed proteins were immunoprecipitated using anti-MYC antibodies and analyzed by WB as indicated. (b) Total cell lysates from HeLa cells non syncronized (NS) or synchronized in mitosis by double thymidine block and nocodazole (S) were immunoprecipitated with control (CTRL) or anti-Citron antibodies (α-CIT). Immunoprecipitations (IP) and total lysates (Input) were then analyzed by WB with the indicated antibodies. (c) Total cell lysates from wild-type P4 mouse cerebellum (2 mg) were immunoprecipitated as in (b). IP and total lysates (Input) were then analyzed by WB with the indicated antibodies. Ig, immunoglobulins. (d) Asynchronous HeLa cells were processed for immunofluorescence using the anti-CK2α and anti-Citron antibodies. The two proteins colocalize at the midbody of late telophase cells. Scale bar=5 μm. (e) Asynchronous HeLa cells were processed for immunofluorescence 48 h after transfection with the indicated siRNAs using the anti-CK2α and anti-α-tubulin (α-TUB). The region containing the midbody of two dividing cells was magnified in the inset. Scale bar=5 μm. (f) HeLa cells either nontransfected (−) or transiently transfected with eGFP or with the S444D TUBB3 mutant were transfected after 24 h with control (Ctrl) or with CK2α-specific siRNAs. After 48 h, the percentage of binucleated cells was quantified as described above. The knockdown of CK2α was verified by WB (left panel). Scale bars=10 μm. ***P<0.001

