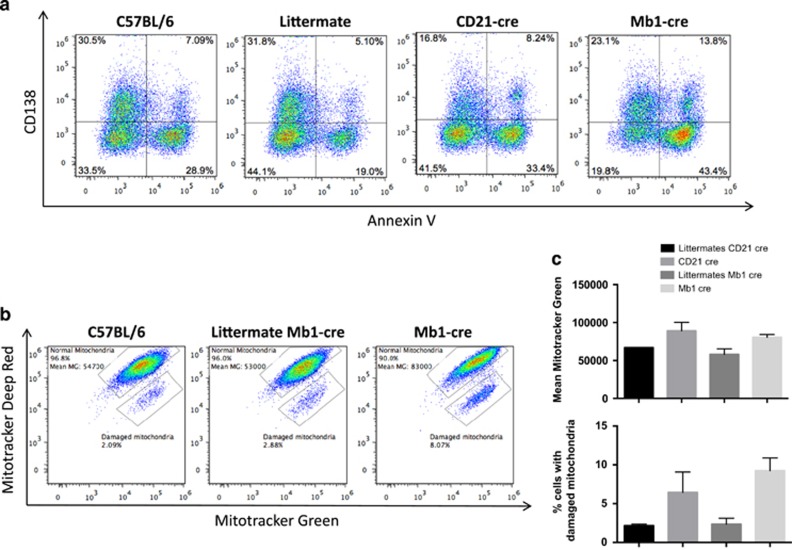
Figure 5.
Differentiation of B cells into plasma cells in the absence of ATG5. (a) C57BL/6, Atg5f/+ CD21 cre (littermate CD21 cre), Atg5f/− CD21 cre (CD21 cre), Atg5/+ Mb1 cre (littermate Mb1 cre) and Atg5f/− Mb1 cre (Mb1 cre) were stimulated by 5 μg LPS for 48 h. Cells were stained by Annexin-V and anti-CD138 antibody, and analysed by flow cytometry. The percentages indicate the proportion of cells among total events after debris exclusion based on FSC/SSC profile, in the corresponding quadrants. (b and c) The same cells were stained with mitotracker green and deep red. (b) Representative dot plots obtained after analysis of the indicated samples, after gating on live cells based on FSC/SSC profile, showing the repartition of cells that display proportional staining for both markers indicative of normal mitochondrial membrane potential (normal mitochondria). The fluorescence mean of mitotracker green in this population is indicated. The proportion of cells with specific decrease in mitotracker deep red, indicative of a disturbed mitochondrial membrane potential is also indicated (damaged mitochondria). (c) Histograms showing the means of fluorescence in the population 'normal mitochondria' and the means of cell percentage of 'damaged mitochondria' population. The results are obtained on n=2 mice for each genotype, the bars stand for S.D.

